Do your students struggle to identify slope types? Do they struggle to visualize the difference between negative and positive slopes? Zero Slopes? Undefined slopes? Keep reading to discover solutions for slopes in algebra.
#1 – Why Students Struggle with Slopes in Algebra
Slopes in algebra make sense when we teach this concept every year. Due to this, I find it helpful to think back when I could not easily tell the difference between a positive and negative slope. To make matters more challenging, all images on the page were in black ink on a white background which made all the significant parts so difficult to identify: axes, grid lines, lines, and points. All parts merged into one image.
A. An Introduction to Visual Perception
First, let’s consider what visual perception is. Visual perception is an interpretation of what we see. For example, imagine clear glass that contains a blue liquid. If the glass is in the kitchen, we may assume it is a drink. If it is in the craft room with paintbrushes, we assume it is paint. To make these assumptions, we make connections based on the surroundings associated with the object we see.
On the other hand, how many times have you pulled a strange object out of the washer? Your memory does not connect this object to anything you have seen before. Next, your imagination gets the best of you as you consider all the possible things it could be. This is what graphing is like for students.
B. An Experiment with Visual Perception: Student Sense of Slopes in Algebra
Next, to experiment with this concept further, let’s consider four similar images below. As we view these, let’s consider what words or thoughts come to mind as we look at each.

Now let’s consider our observations. Baseball? Berry? A bird beak seen through the hole of a birdhouse? Then again, which part is the beak? The bigger part or the smaller part? You may have seen something different. Let’s look at another image.

What did you see this time? Notice the warm, yellow color. I saw the sun rising behind a mountain.

Furthermore, notice that green and blue colors are added. Another image has been added for interest. Is it an eyeball? Maybe, Pacman without an eye, ready to eat a blue dot? What did you see?
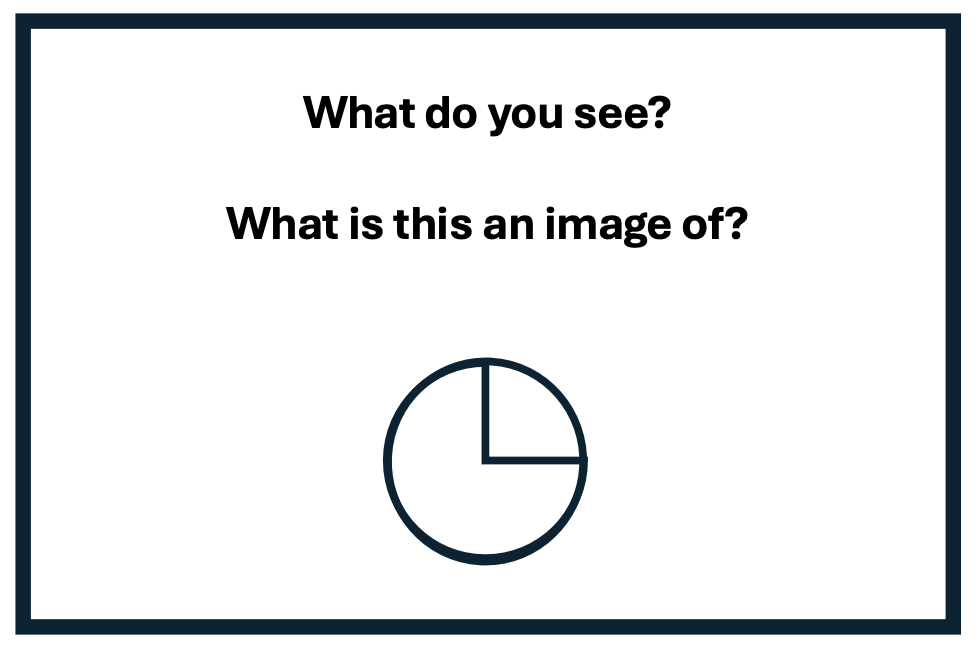
Next, notice there is no color and the image has shifted direction. I see 3:00. Do you see 12:15? A baker may have seen 3/4 of a pie or only 1/4 of the pie left. As math teachers, it would not be unusual to interpret the image as a fraction. If you saw a fraction, did you think of it as 1/4 or 3/4? As you can “see,” our perceptions, based on our life experiences affect what and how we see something.
C. Famous Visual Perceptual Illusions
In addition, you may remember the famous visual perception illusions such as the young woman vs. the old lady. Another famous visual perceptual illusion is illustrated in the Muller-Lyer illusion when determining line length. Below are links to both.
What You See in This Famous Optical Illusion Could Reveal How Old You Are
https://www.livescience.com/63645-optical-illusion-young-old-woman.html
How the Müller-Lyer Illusion Works
https://www.verywellmind.com/how-the-muller-lyer-illusion-works-4111110
D. Student Visual Perception and Interpretation of Slopes in Algebra
Therefore, just as our visual perception can be deceived, we now have a better appreciation for our students who struggle with visual perception related to slopes in algebra. With new eyes, let’s look at the graph, below.
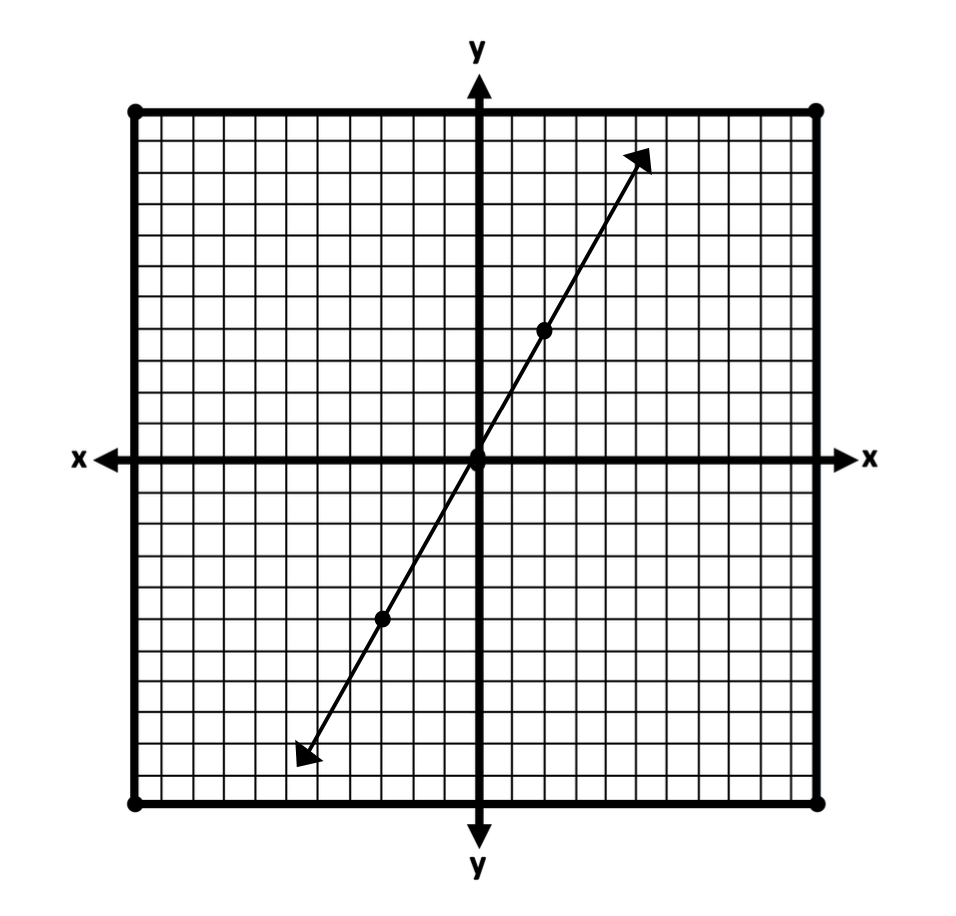
As we look at this image we quickly identify the x and y axis, a positive slope with two points on the line.
On the other hand, the average student may look at the same. Though there are parts within the whole, students may not recognize this. Lines may blur together, making the “whole” appear “gray”. Students with significant visual perceptual challenges may become nauseated if the lines “appear” to move.
Also, notice that the line includes an arrow at both ends. One arrow points up and another line points down. Some students may interpret the line as both positive and negative. For example, the arrow pointing upward may be assumed to be a positive part of the line. Likewise, the arrow of a line pointing down may be thought to be a negative part of the line.
#2 – Sentence Strategy
Now let’s consider the sentence strategy.
First, write a sentence on the board. Ask students what direction the words traveled. Some students may benefit from the word, “left” written below the first word of the sentence, and “right.” written below the last word of the sentence. After practicing sentences and emphasizing the movement of a sentence from left to right, students will practice this concept on notebook paper, labeling “left” and “right” beneath each sentence.
Next, provide students with an image of a graph with a line. Students will write two questions about a jogger running up or down a hill. Emphasize that just as the sentence moves from left to right, the jogger always starts from the left side of the graph.
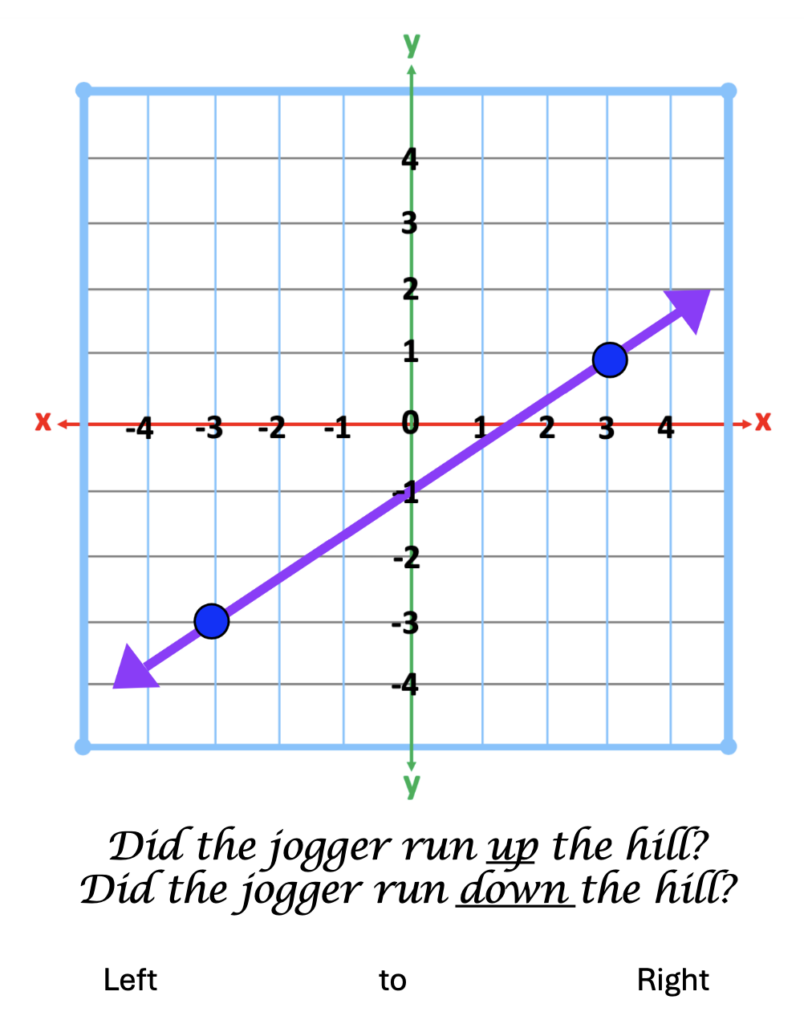
Next, write a sentence, following the rise of the line on the graph, from left to right. Below the graph, write one sentence that describes the direction of the slope, “The jogger runs up the hill” Below that sentence, write a sentence from left to right explaining the type of slope, “This is a positive slope.”
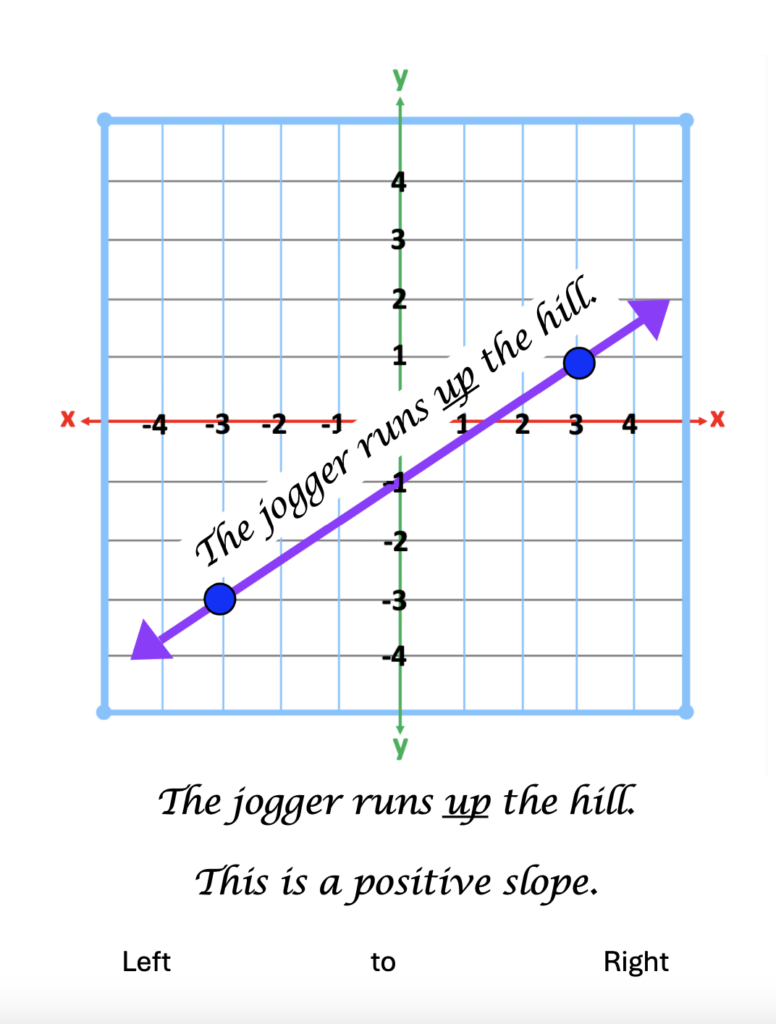
Furthermore, this strategy can also be used for negative slopes.
#3 – Tactile and Upright Surface Strategies
Next, get students up and moving. Provide each student with an image of a positive or negative slope. The slope must include two points. One point must be located to the far left of the line. The other point must be located on the far right of the line. See the examples below.
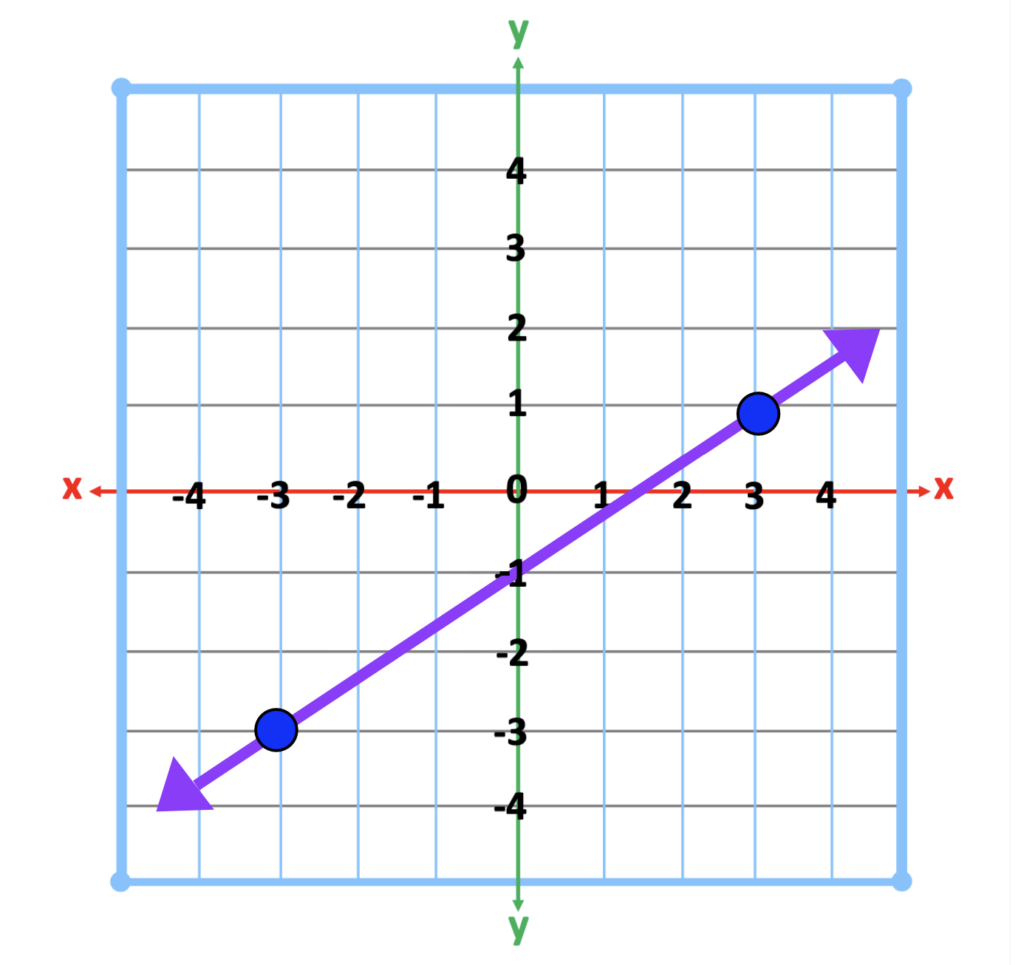
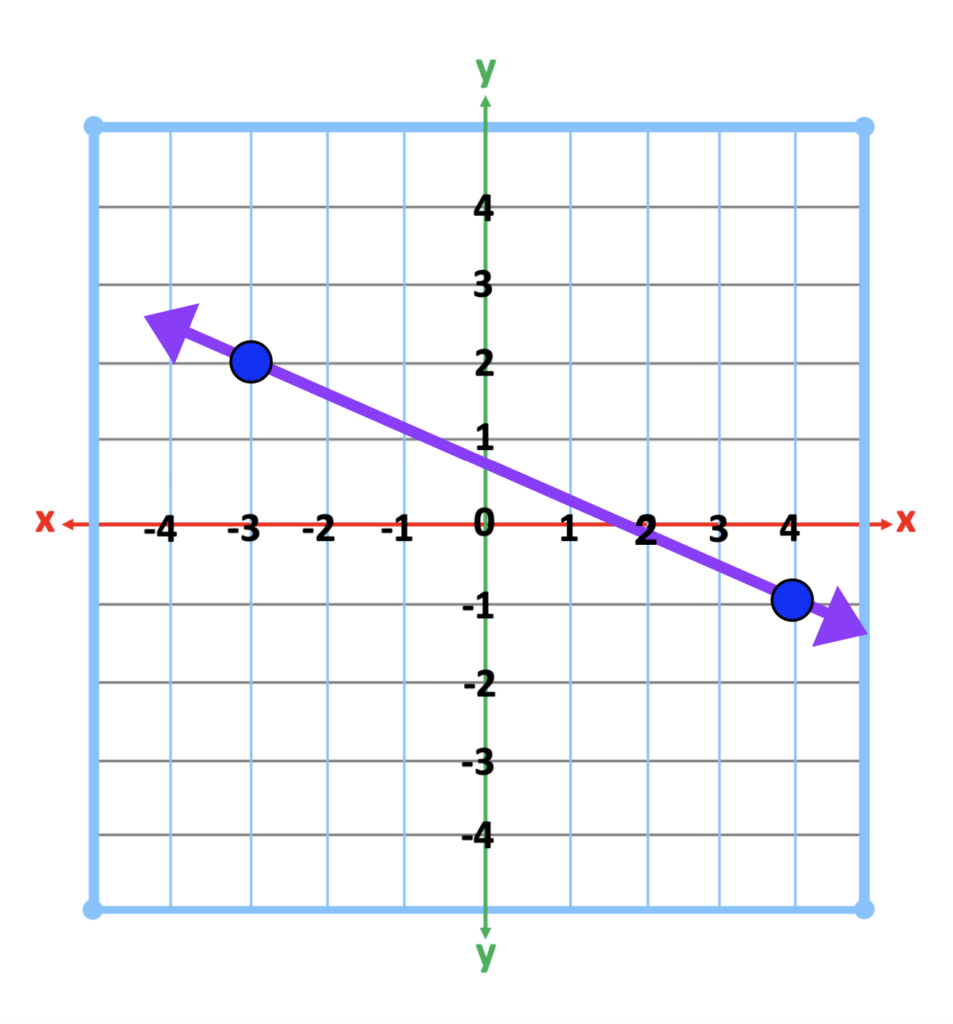
Instruct students to find a place on a wall to tape the image. Next, students must find the dot on the line closest to the left side of the line. After locating this point, students will slide their index finger from that point to the next point on the line. As students trace the line, students will be able to feel the rise or fall of the line. For example, if the line represents a positive slope, they will notice that the movement of the line continues to rise. If the line represents a negative slope, the movement of the line will fall downward.
In addition, this strategy can also be applied by placing the page on the slanted portion of a binder.
#4 – Zero and Undefined Slope
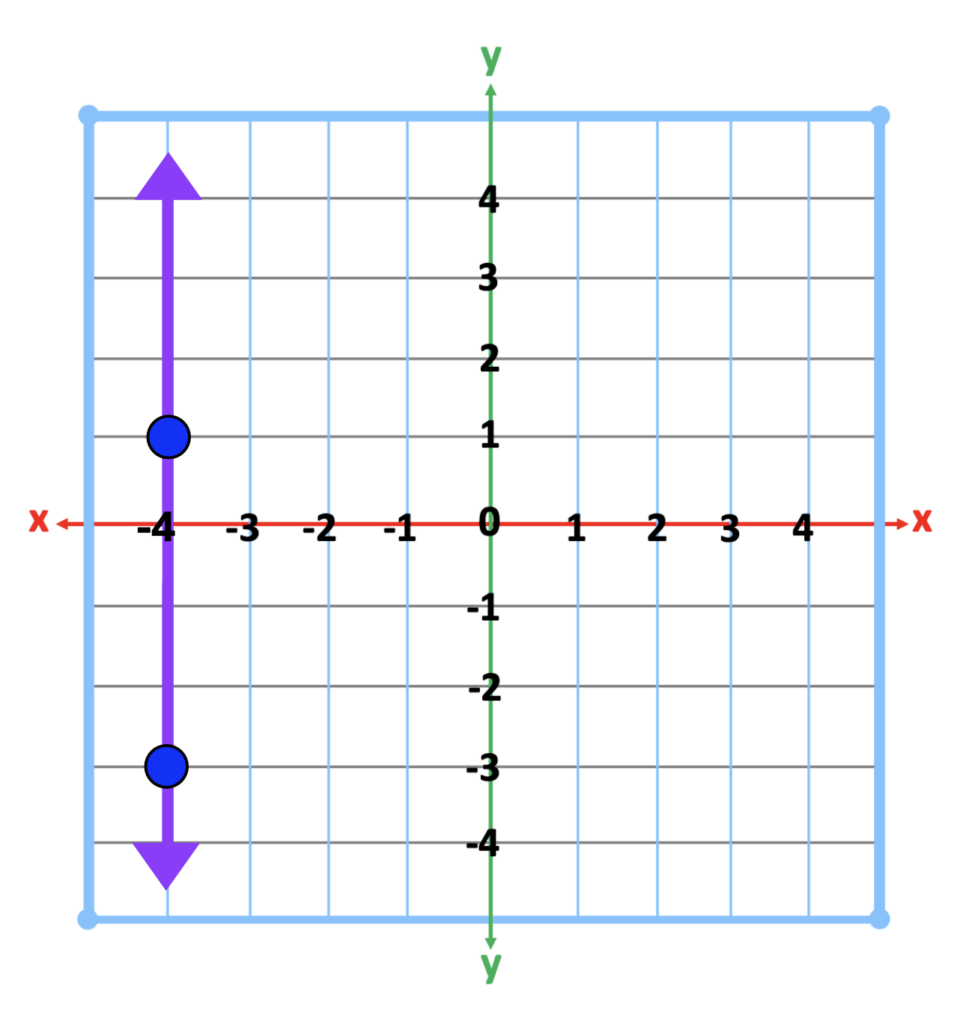
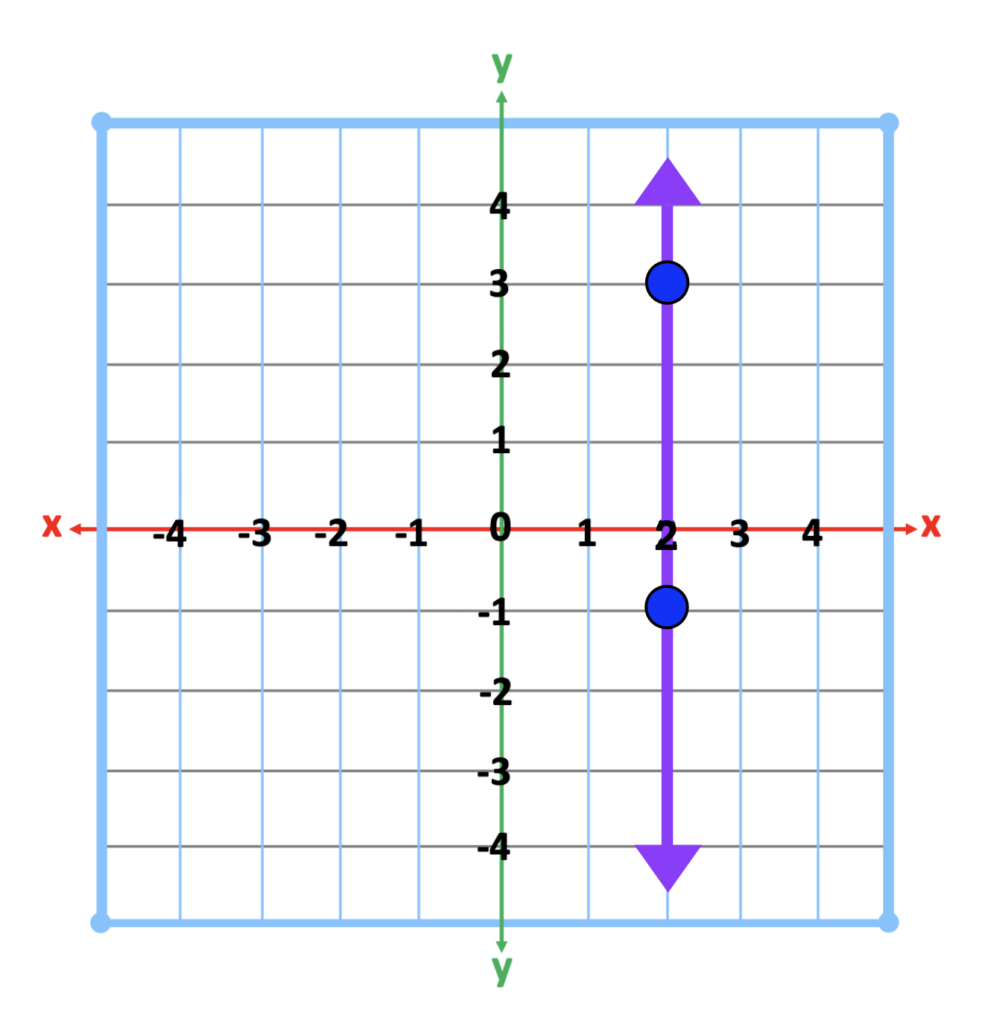
Next, introduce the zero and undefined slope. The tactile and upright strategy can also be applied. Explain that both of these slopes are unique as they are opposites. The zero slope is exactly what it says. There is no slope. It is like a flat road. The undefined slope is the zero slope rotated 90 degrees. Imagine it is as straight as a flag pole, or the Space Needle in Seattle, Washington. Below are two images representing zero slope.
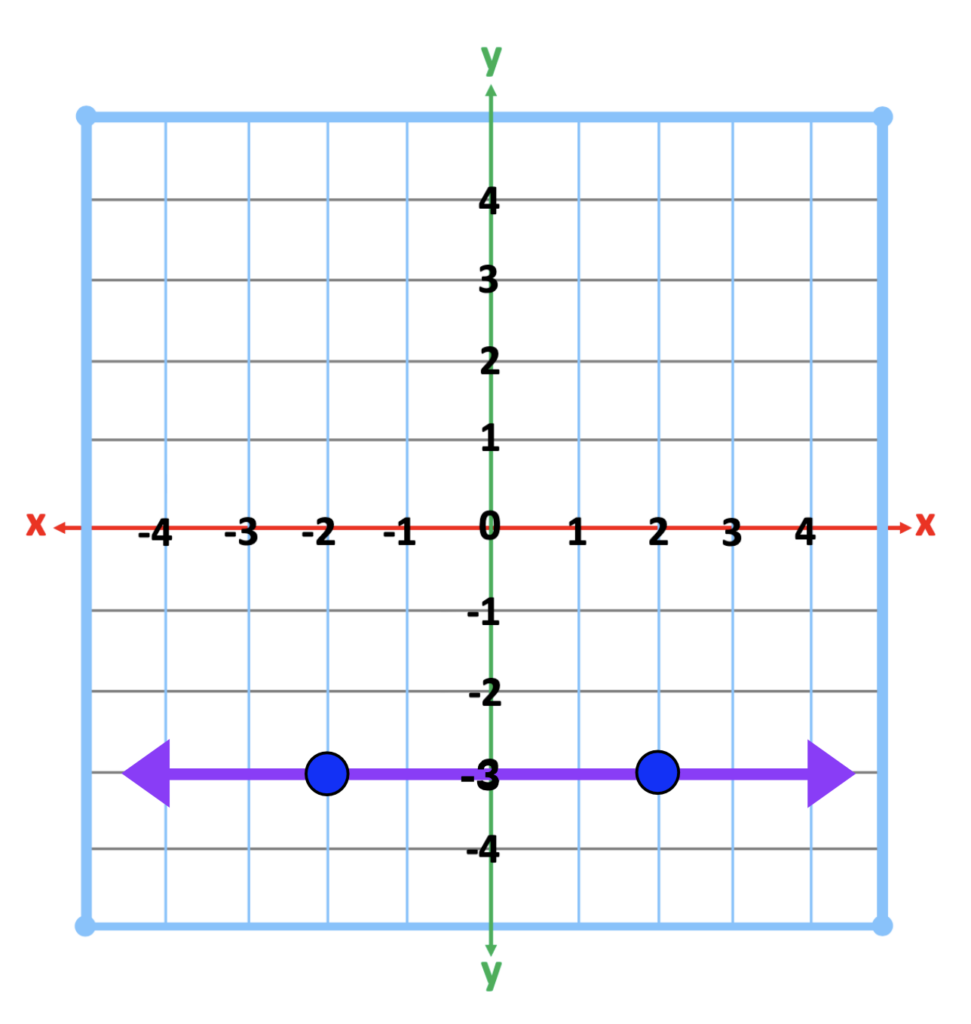
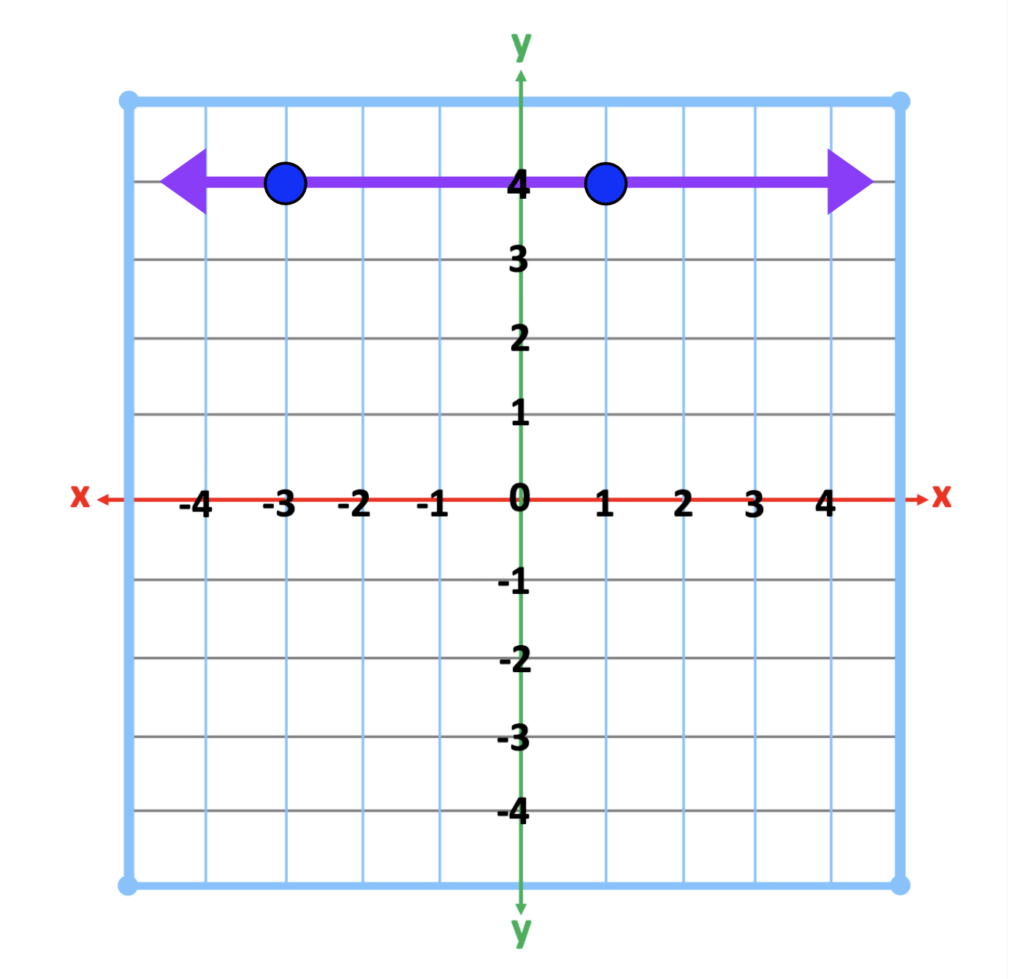
Likewise, the next two slopes are examples of undefined slopes.
Conclusion
In conclusion, when we recognize the effects of individual visual perception, we become sensitive to our students who struggle with slope concepts. Secondary to variations in visual perception, tactile and upright activities help students perceptually “feel” the difference.
Other Related Posts and Resources
How to Write Equations of Horizontal and Vertical Lines
Looking for More Materials?
Click the button below to view more of my educational resources!
