Do you have students who struggle with graphing linear equations? Do they struggle to make sense of words and phrases related to graphing? Maybe you repeat the examples several times and they still do not “see” how to solve the problem. In actuality, this may not be far from the truth. Keep reading to discover how to help students succeed when graphing linear equations.
#1 – Directional Interpretation Challenges
Graphing linear equations requires a significant awareness of direction.
Let’s consider students plotting ordered pairs. A student is busy at work. You are happy to see such engagement. Your heart sinks as you get closer. Bless his heart. For the ordered pair, (1, 3) he placed a dot at 1 on the x-axis, and 3 on the y-axis.
Furthermore, consider some of the terms used.
Slope = rise over run. This definition works great if the slope in the equation is positive. We’ve all been there for the student who struggles to graph an equation with a negative slope.
“Doesn’t rise mean the line should go up?”
Directional challenges are not limited to students with learning disabilities or other challenges. These challenges may also arise in bright math students. To prevent students from becoming discouraged, provide additional strategies and options.
#2 – Provide Graph Paper Options
In addition, as I review various worksheets with graphs, I notice that some worksheets provide little space between lines making it difficult to see and plot points. Some graphs have an x and y-axis lines that blend in with the other lines. This makes it very difficult to know where to begin. Some students may share that the lines move. This makes it difficult to locate or place a point on the graph.
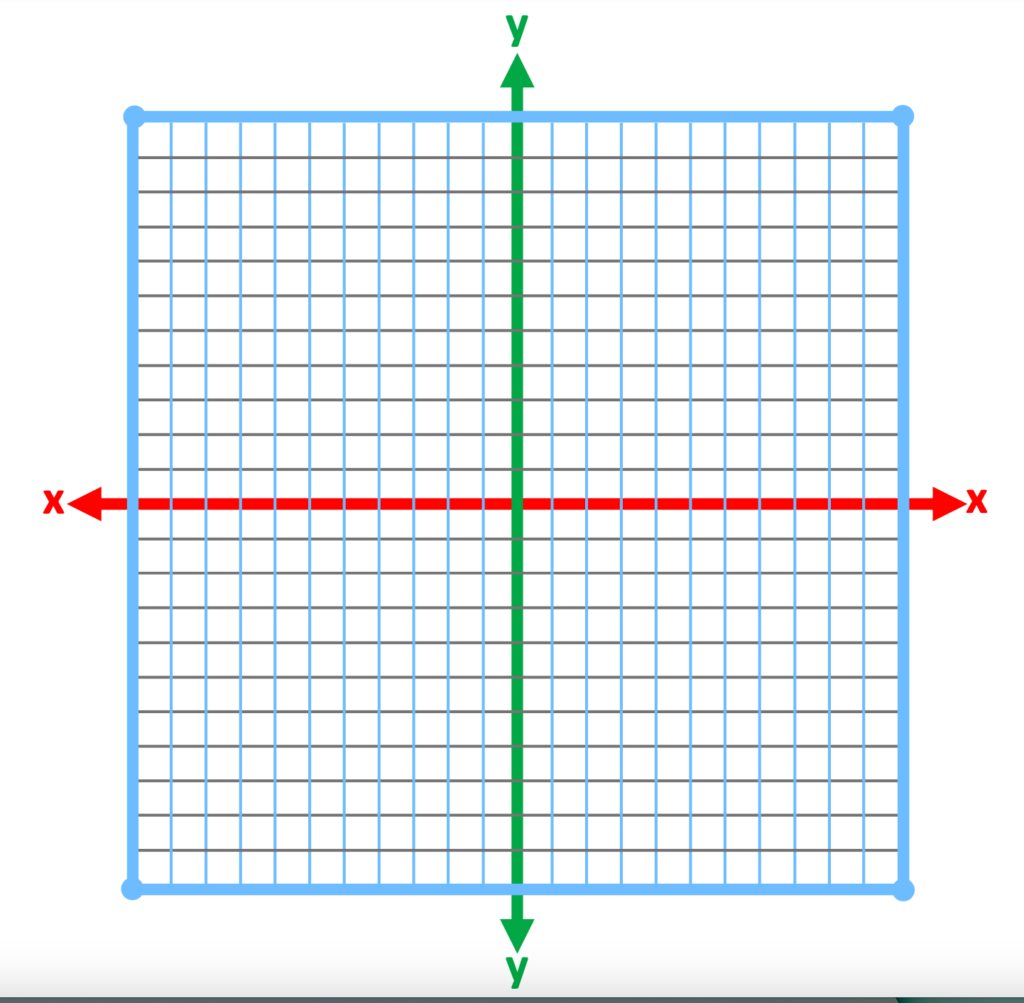
To provide a positive learning experience, provide graph paper with larger unit spaces. Look for x and y axes that are bolder than the other lines. Have on hand a variety of sizes and styles to choose from. This will allow students to select one that may work best. What works for one student may not work for another.
The size of the image has been reduced. Notice how much easier it is to see the x and y axis. Also notice that the grid lines are two different colors, light blue and light gray.

Other strategies may also be used. Computer-based assignments may also be easier if there is an option to expand the size of the worksheet. When illustrating a graphing problem, displaying notes on a large screen.
#3 – Use Color-Coding for Graphing Linear Equations
Furthermore, consistent color-coding is very effective for visualizing graphs and equations. It helps students visualize the parts from the whole.
Though various colors may already be used for instruction, I will share some of my favorite colors and how I apply the colors. When I begin teaching the Cartesian Plane, my students highlight the x-axis in red and the y-axis, green. This immediately helps students see that these two lines are different. As we discuss ordered pairs, x/y charts, domain, and range, I use the same colors for x and y.
Furthermore, as I explain the slope-intercept form, I use red for x and green for y. For the slope, I use a bright purple. The y-intercept is in bright blue.
Students begin to develop visual associations with color and concepts. This helps students make connections between graphing concepts.
#4 – Use Body Movement
Likewise, body movement is a great way to integrate directional awareness. Body movement also helps increase student alertness.
A fun way to illustrate different slopes is through body movement. Select a student who enjoys being upfront and has a good sense of body awareness. The student demonstrating comes to the front of the class, and back faces the class. You call out different types of slopes. The student in front of the class illustrates these movements as the rest of the class imitates.
On a smaller scale, the student illustrating in front of the class may also trace a line from left to right on a whiteboard, as students do the same on their paper.
Conclusion
Success when graphing linear equations begins with an awareness of the potential for directional interpretation. These challenges can be met using modified graphs, color-coding, and body movement.
Other Related Posts
How to Successfully Explain the Relationship Between x/y Coordinates and Linear Equations
Teach Students How to Plot Points on the Cartesian Plane
How to Graph the Equations x=0, y=0: Vertical and Horizontal Lines
1: How to Successfully Explain the Slope Formula
Domain and Range with Algebraic Functions: How to Understand
Mapping Functions Strategies: How to Explain
Below you will find a resource providing 36 different graph variations. Check it out! Learn more!

Looking for More Materials?
Click the button below to view more of my educational resources!
