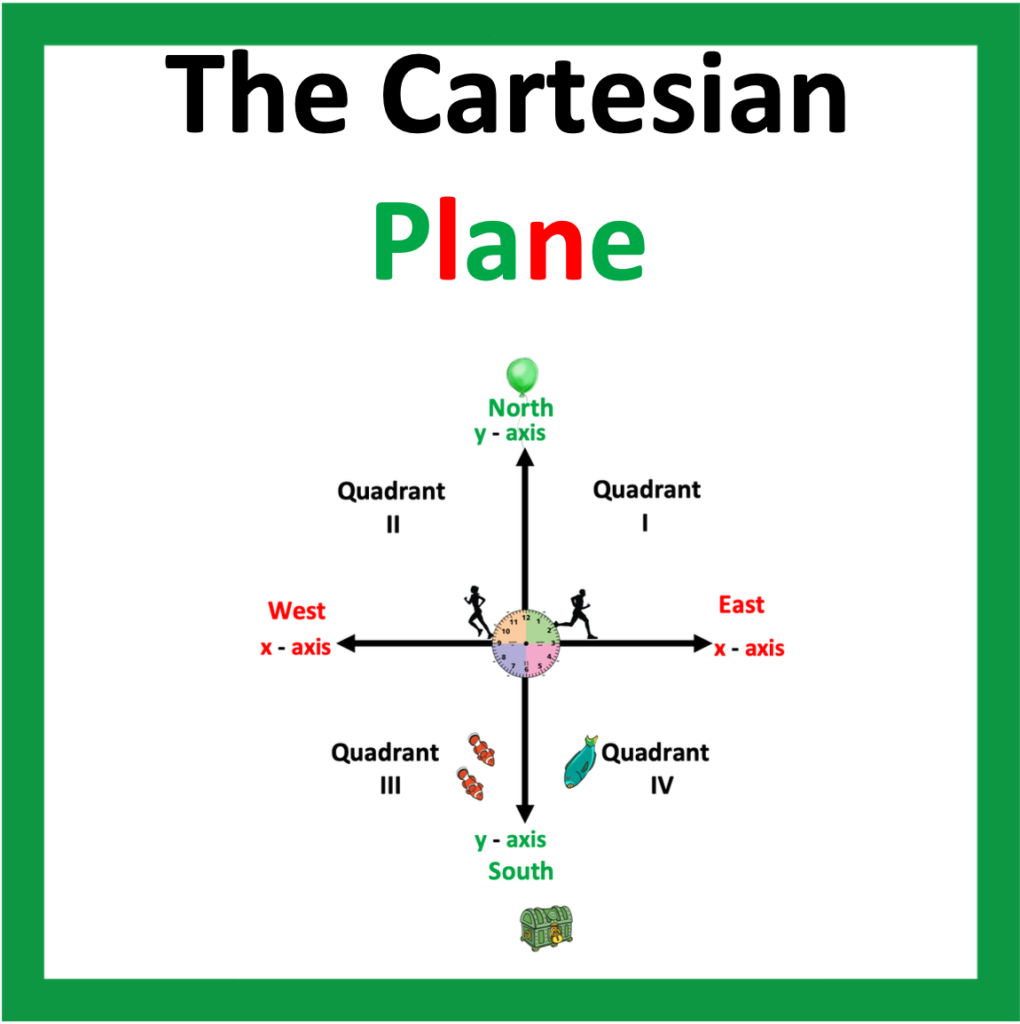
Are students struggling with graphing vertical and horizontal lines, such as x = 0, or y = -3? Are the math terms used for this concept challenging for students to understand? Vertical? Horizontal? As you continue to read, you will discover how to successfully teach students how to graph the equations x = 0, y = 0; vertical and horizontal lines.
Contents
- Introduction
- How to Successfully Teach Graphing Vertical and Horizontal Lines
- 1a. Understanding Directional Confusion
1.b Strategies
2a. Understanding Visual Perception
2b. Strategies
3. Plotting Points on a Separate Horizontal and Vertical Number Line
4. Plotting Points on the Cartesian Plane
5a. Graphing the Line of an Equation When x =
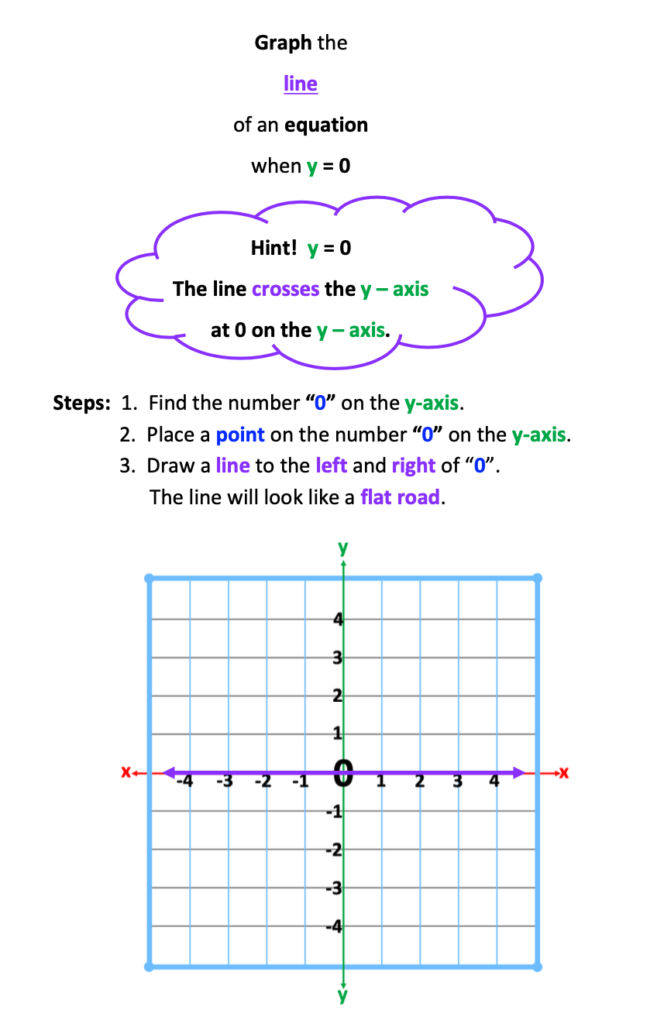
5b. Graphing the Line of an Equation When y =
6. Writing the Equation of a Line
Conclusion
- 1a. Understanding Directional Confusion
1a. Understanding Directional Confusion
Directional confusion refers to student challenges with interpreting such terms as right and left. Other words associated with directional confusion include the terms, “up,” “down,” “right,” “left,” “around,” “through,” and other prepositional terms.
Directional terms are also used when graphing lines of an equation. Some of these terms include:
“Horizontal”
“Vertical”
“Two units to the left”
“Five units up.”
Secondary to directional confusion, students will benefit from specific instruction for these terms.
1.b Strategies
How do we learn directional terms? Most often, these terms are introduced in written or verbal form, meaning that we do not feel or see what they are like. Given this, we learn these concepts by feeling movement and seeing illustrations. Below, are activities to increase understanding of directional terms.
1. Body Movement: As a group, students move as they state each directional term
Horizontal: Arms out to side
Vertical: Stand straight as a pole.
Two units to the right: Take two steps to the right.
Two units to the left: Take two steps to the left.
2. Identification of objects that illustrate the terms: For example, a counter top is horizontal whereas a tall pine tree is vertical.
3. Practice positioning the object horizontally and vertically. Use objects such as pencils or rulers. See the example below.


2a. Understanding Visual Perception
Furthermore, it is not unusual to find that an over-abundant amount of visual details on a page may also increase student stress.
For example, a lab in biology may require the dissection of a frog. Preparation for this delicate procedure may include reviewing a picture illustrating the various organs. If the picture is in black and white, some students may not be able to easily identify the parts as the images may appear to be squiggly lines, dots, and blobs.
This is similar to what the Cartesian Plane looks like to some students. This may be due to background lines that are too close together, too thick, or too thin. The x and y axis lines may have the same thickness as other lines making it difficult to find the x or y axis, if there are no numbers on the graph.
Due to these challenges, it is not unusual to hear student comments such as:
“Where is the x and y-axis? All I see are a bunch of lines.”
“It looks like a blob of gray.”
“Every time I start to move up the axis, the lines start moving on me and I have to start all over again!”
“I’m getting a headache.”
“I am feeling nauseated.”
2b. Strategies
To decrease these challenges and increase student ability to easily use the Cartesian Plane, consider the following components when choosing a Cartesian Plane for graphing:
1. Use a graph with an X and Y axis in different colors; x-axis, red, y axis, green.
I like to associate the red axis with the “ex-it” sign. Green is an effective contrasting color.
This also helps students easily distinguish between both axes as some students may visually interpret 4
non-related lines emerging from the origin of the graph.
2. Provide a graph with an X and Y axis containing a thicker line than other vertical and horizontal lines.
3. Ensure background lines are slightly thinner than the x and y axis.
4. Consider the background lines of the graph. Lines of light to pastel colors work well.
Colors such as sky blue or gray work well.
5. A graph with numbers for the x and y axis are also helpful.
6. When using copies of Cartesian Planes that are printed in black ink only:
Using a ruler, trace the x-axis red and the y-axis green.
Encourage students to do this, prior to graphing points.
Place copies of graphs in page protectors for use with dry-erase markers.
This provides for practice and saves on paper and ink.
Once you are equipped with the best graph paper, you are well on your way to successfully teach students how to graph vertical and horizontal lines.
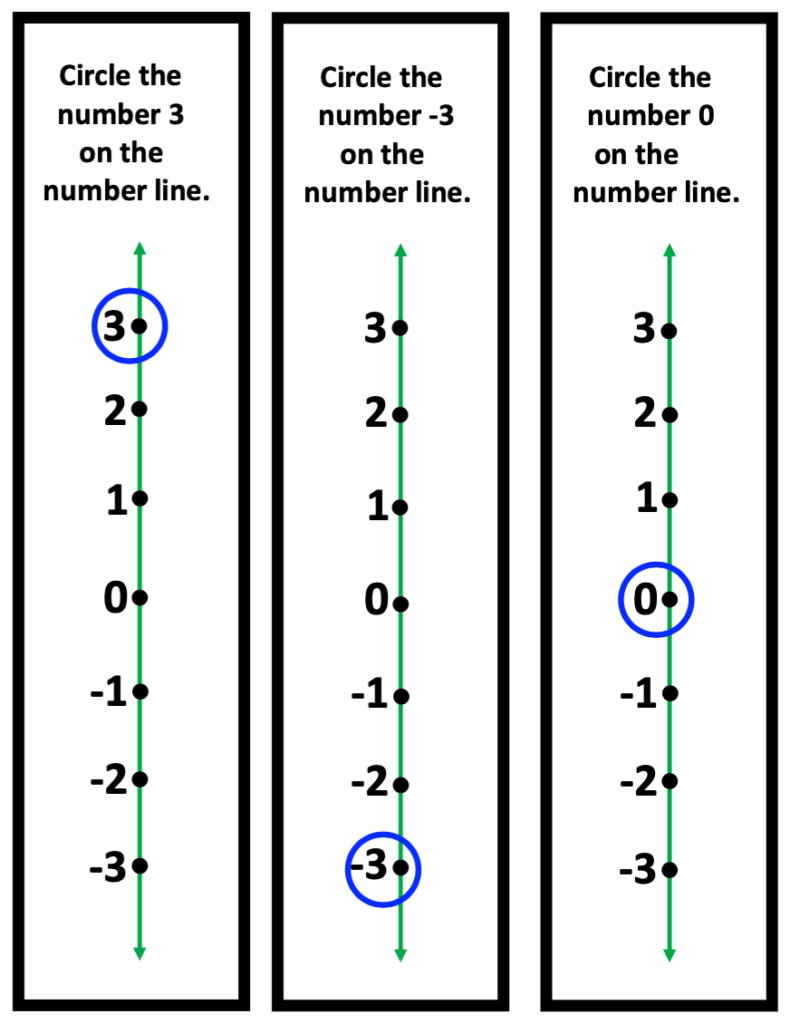
3. Plotting Points on a Separate Horizontal and Vertical Number Line
Start simple. Begin with illustrating points on a horizontal number line. Include the following numbers: positive, negative, and 0.
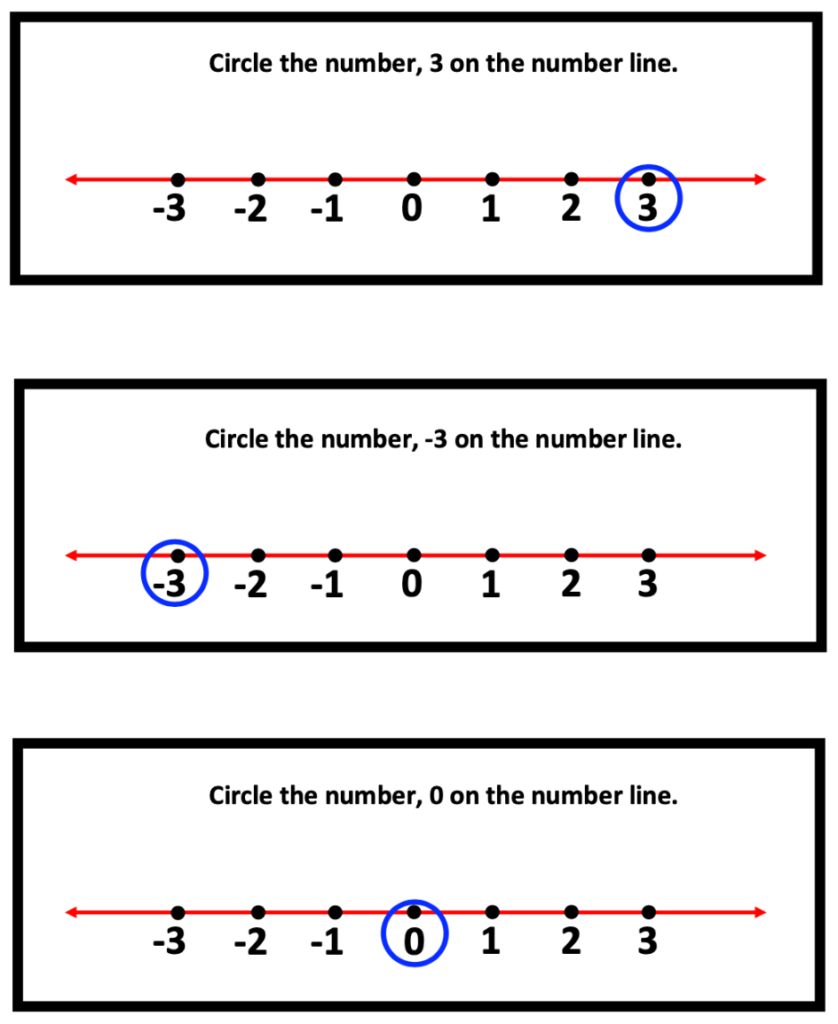
Repeat the same concept for the vertical number line. Tell students that the vertical number line can be compared to a thermometer.
4. Plotting Points on the Cartesian Plane
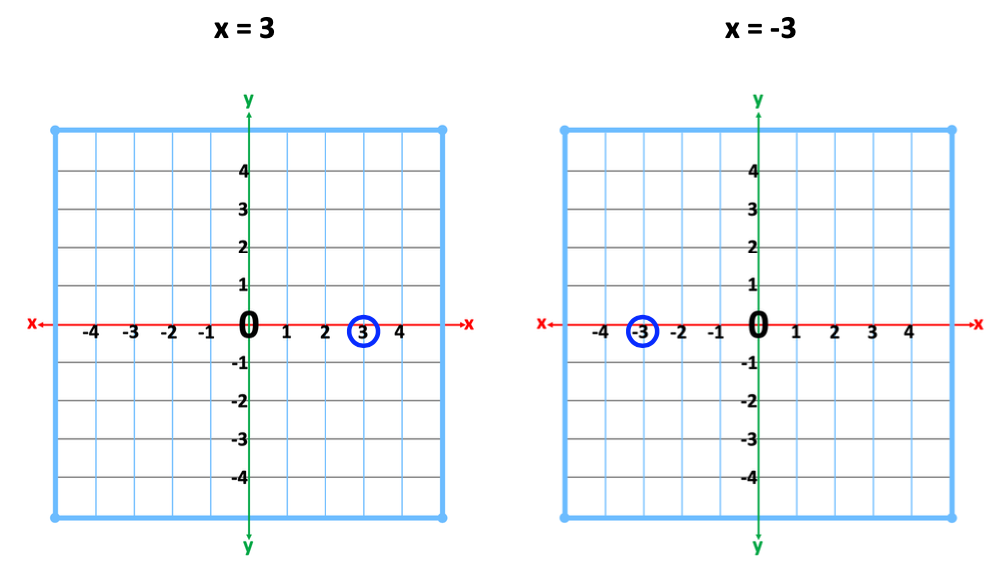
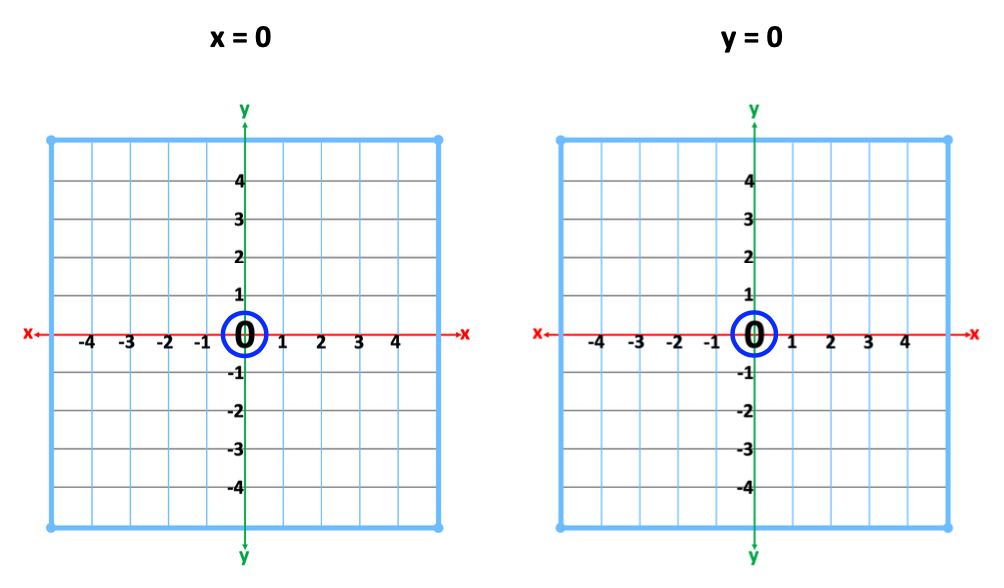
Once students can find points on a number line, introduce these points on the Cartesian Plane. Explain that the number lines have just merged at zero. Review how to locate these same values.
5a. Graphing the Line of an Equation When x =
Now that students are visually familiar with the Cartesian Plane, they are ready to learn how to interpret directions commonly associated with graphing lines of an equation.
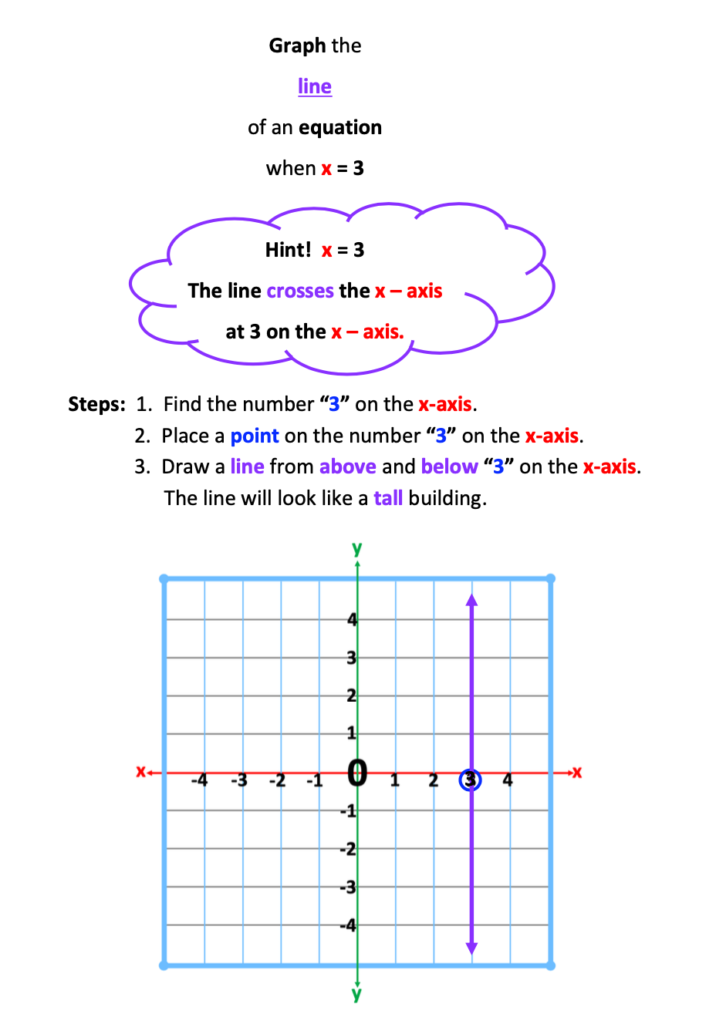
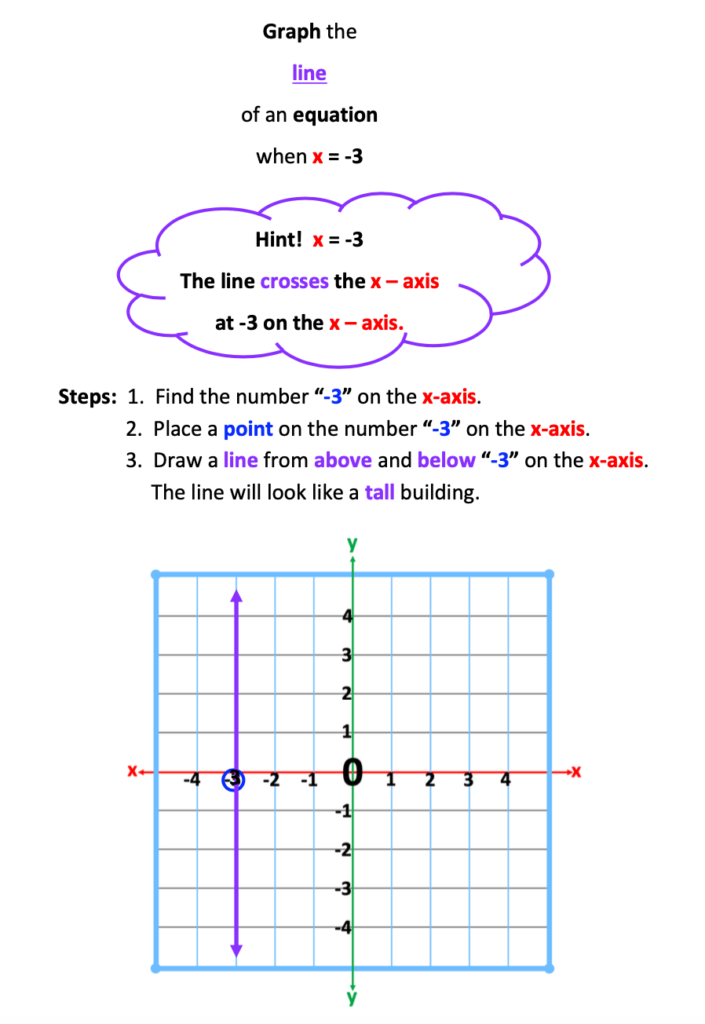
“Graph the line of an equation when x = 3.”
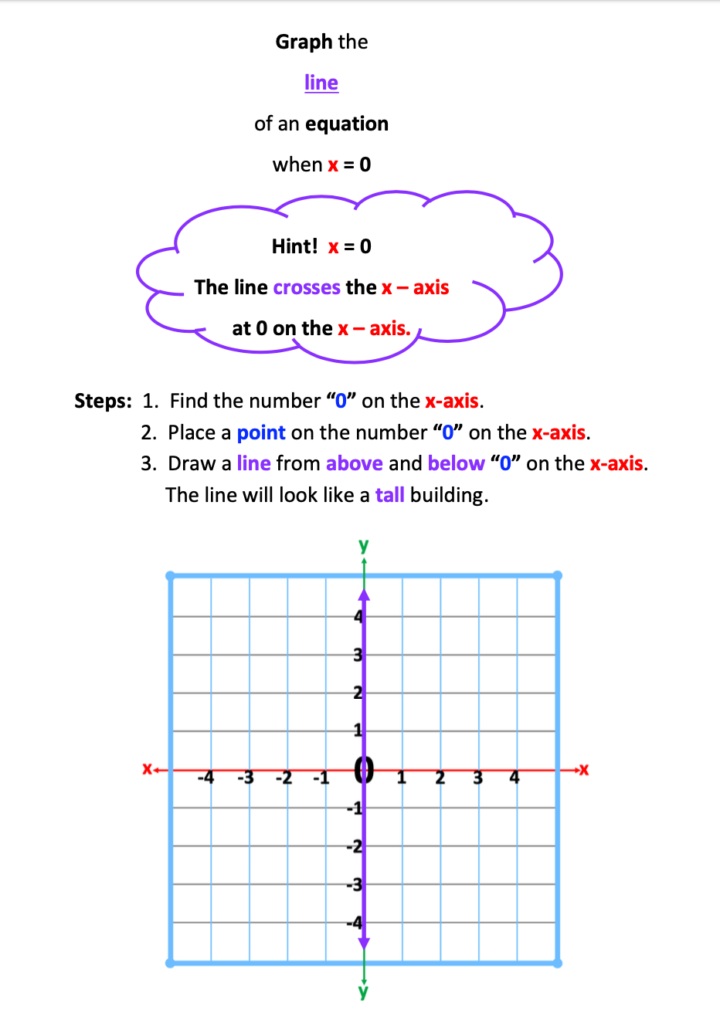
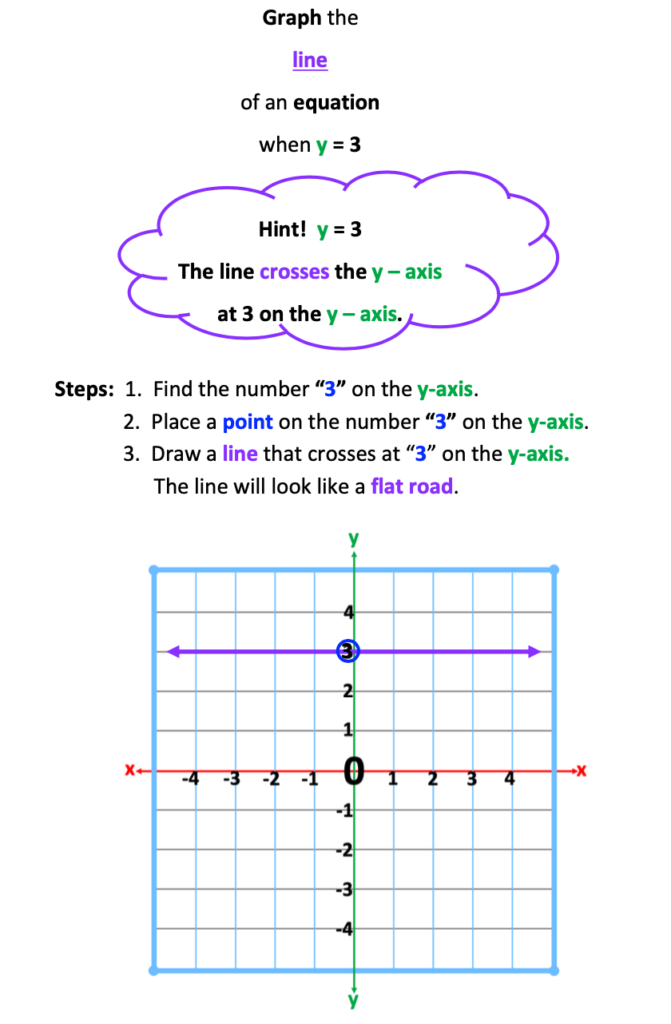
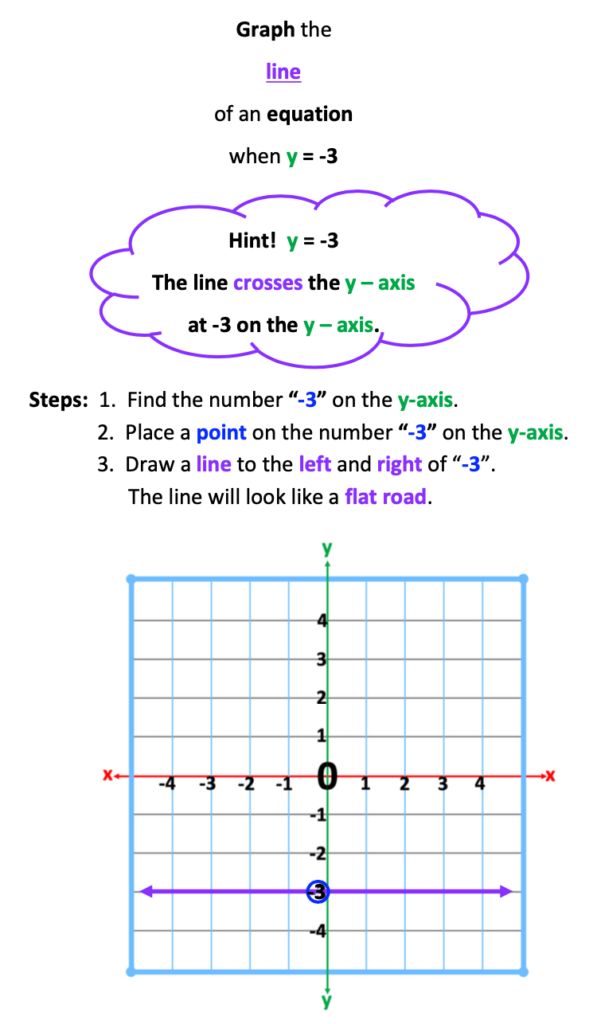
It is not unusual for students, particularly those with reading comprehension challenges, to struggle interpreting the meaning of the above statement. Secondary to this, help students visualize the parts of the statement by breaking the words up and using colors to associate words to pictures. Below are six illustrated examples.
Of all the equations,
resulting in vertical and horizontal lines,
the following appear to be
the most baffling
to students :
x = 0, and y = 0.
Students, when left on their own to figure this out, will simply place a point at zero and from that point, remain quite uncertain about what to do next.
What to do?
Using one graph, students graph the following lines: x= 3, x = 1, x= -2, x = -4. Last, they are to graph x = 0. As the numbers graphed prior to this have been vertical lines, and have all crossed the x-axis, students are more likely to reason that x = 0 must cross the x-axis as well.
This is the beginning of success for graphing vertical lines.
5b. Graphing the Line of an Equation When y =
Writing the Equation of a Line
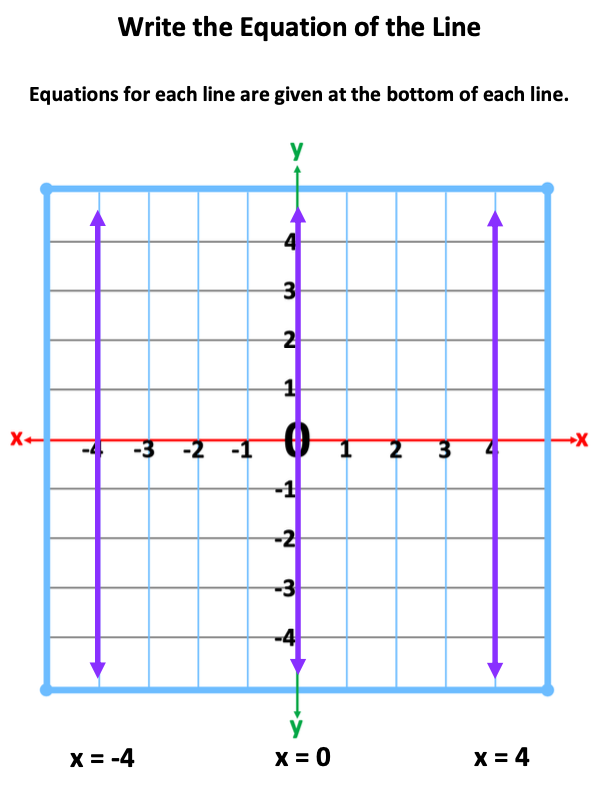
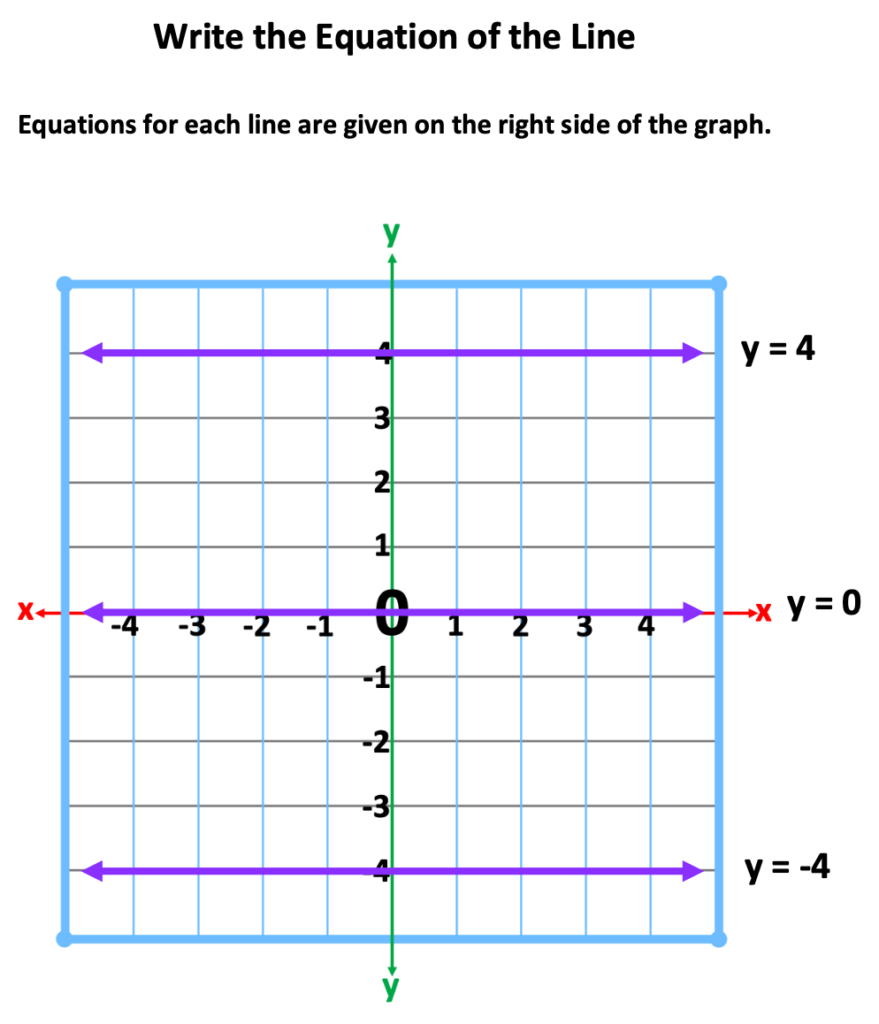
In the following illustrations, you will notice that three equations and lines are included on each graph. The equations and lines represent a positive number, negative number and zero.
When providing examples for writing the equation of horizontal and vertical lines, follow the steps below.
Step 1: Illustrate the positive value, such as x = 4.
Step 2: Illustrate the negative value, such as x = -4.
Emphasize in the first two steps that the equation tells which axis the line will cross.
Furthermore, the positive number followed by its negative number provides an experience of visual symmetry. In general, we enjoy images that demonstrate symmetry or balance.
In addition, as students observe the lines on the graph and the corresponding equations, determining the equation for the line, x = 0 will come more naturally.
Step 3: Ask students to illustrate the direction of x = 4 and x = -4 by drawing the line in the air. Next, ask students to illustrate the direction of the line for x = 0, followed by writing the equation of this line,
Step 4: Repeat the process for lines representing y = 4, – 4, and 0. After students are able to visualize and feel the direction the line crossing the y-axis at 4 and -4, they will confidently write the equation, y = 0.
Step 5: Provide practice problems in this same arrangement. Continue to review these concepts while learning others such as y = mx + b, (y -y1) = m(x-x1) to ensure students remember how to write the equation and graph vertical and horizontal lines. Like fraction operations, students need continuous review for writing equations and graphing equations of lines.
If practice problems only include one line or equation per graph, instruct students to include its opposite and zero. If the line drawn or the equation equals 0, students may select two other equations and graph the line of each.
Below is an illustration.
Conclusion
Directional confusion and visual perceptual challenges are important matters to consider when teaching students to graph horizontal and vertical lines. By using visually pleasing graphs and moving from simple to more complex examples, teachers will be successful in teaching students and students will become successful in graphing horizontal and vertical lines.
Other topics on graphing may be discovered by clicking on any of the links below.
How to Choose Paper for Graphing on the Cartesian Plane
How to Successfully Explain the Slope Formula
How to Plot Points on the Cartesian Plane
Clip Art Credit
“Graphics by A Hughes Design” (pencils)

