Mapping? Function? Domain? Range? What do all of those arrows mean? If these questions have come up in your Algebra class, you are not alone. Keep reading to discover ways to explain mapping functions.
#1 Where to Begin When a Mapping Functions
When explaining anything new, begin with related topics taught prior. This will allow students to link prior understanding to new learning when mapping functions.
For example, remind students that ordered pairs or values in a table may be used to plot points forming a line on a graph and represent a linear function. Also, review the meaning of the terms, domain and range.
Domain: represents the x-values, input values, that are plugged into a function
Range: the y-values, output, representing the result of an x-value plugged into the function
Review the definition of a function. Explain that a line is a function only if each x-value corresponds with exactly one unique y-value. This may also be worded: A line is a function only if each input corresponds with exactly one unique output.
Next, share that mapping is another way to visualize a function.
# 2 How Does Mapping Relate to X and Y Values?
Once students understand the definition of a function, share that mapping is described as pairing, such as pairing a shoe for the left foot, with a shoe for the right foot.
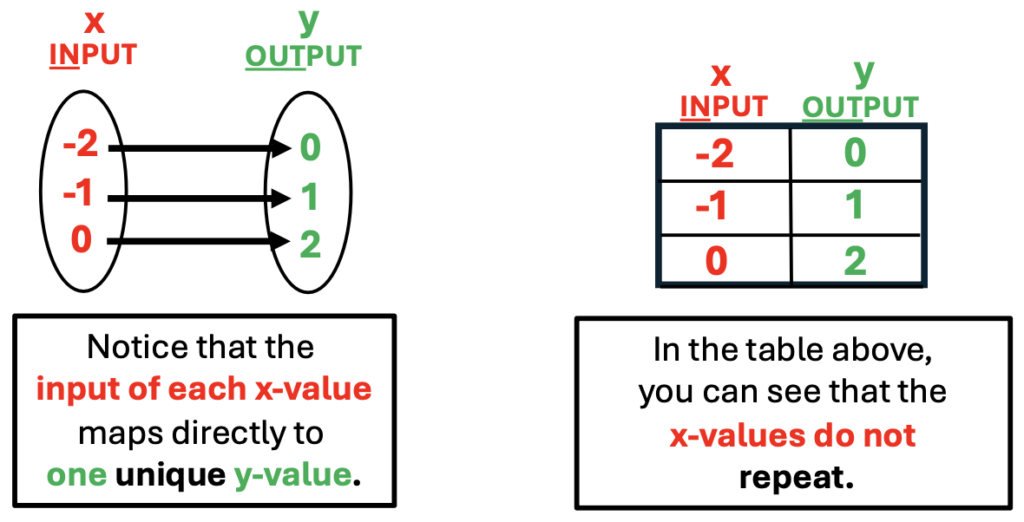
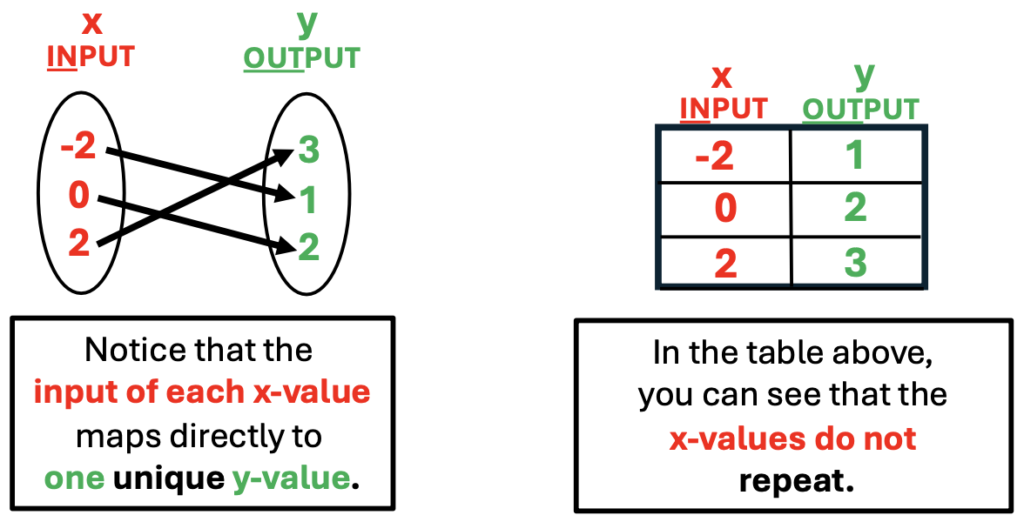
With mapping, a function is also expressed as one in which only one input is paired with a unique output.
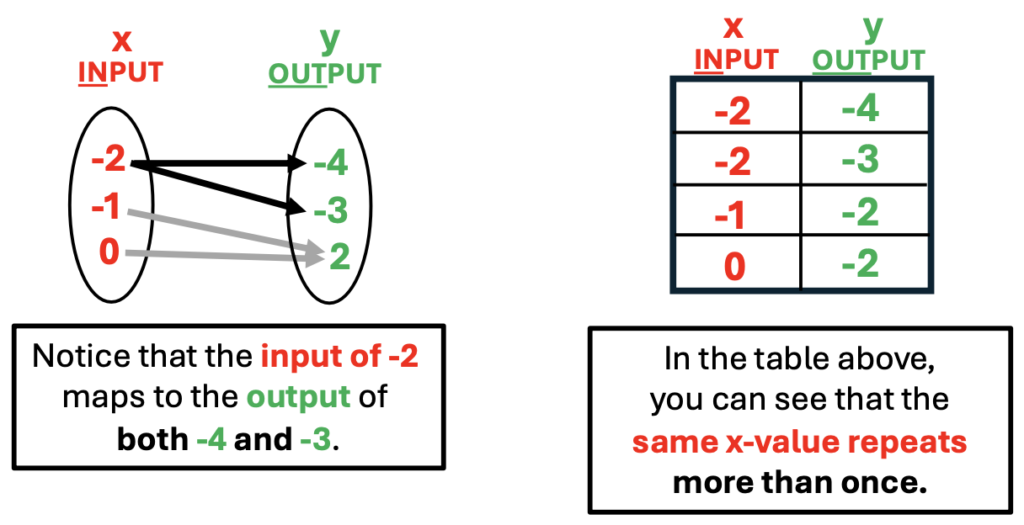
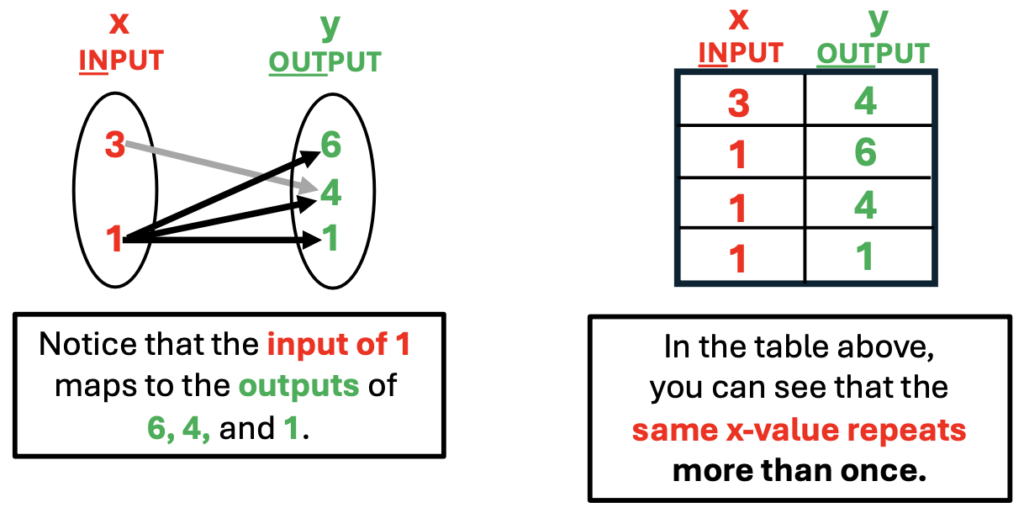
Point out the difference between a table of x/y values and mapping. Explain that mapping is illustrated with the use of arrows. An arrow will begin at the input and then point to the unique output value. If an equation does not represent a function, more than one arrow may point from a specific x-value to more than one y-value.
Observe the differences between mappings that represent functions and those that do not.
Mapping Functions: Examples
Mapping that Does Not Represent a Function
#3 Most Useful Color Strategies
In the illustrations above you may have observed color-coding used to emphasize x and y values. I use red to represent x-values, just as the red”Exit” sign includes the letter, “x”. Green can be thought of as the opposite of red. It is also a bright color. Green works great for “y” values.
I cannot say enough about the use and value of consistent color coding. Whether graphing inequalities or functions on a graph, colors help students visualize similar relationships between input and output, domain and range. The variation in color makes concepts jump off the page. Some students report that color coding increases their ability to memorize information.
Not all worksheets come with color coding. On the other hand, students may color-code as they work.
#4 A Student Activity to Apply Strategies and Concepts
Want to change up the ordinary worksheet approach to increase student engagement? Try this.
Materials: Students will need graph paper, markers, notebook paper and pencils
Group Students: 3 – 4 students per group
Activity
Provide each group with a linear equation. From the equation, students will create a list of ordered pairs, a chart of values, a graph, and a mapping representation that correlates with the equation.
Variations:
1. Students will be given a mapping and then create a list of ordered pairs, a chart of values, and a graph.
2. Students will be given two equations, one that represents a function and another that does not. Students will illustrate both equations on separate pages.
3. Students will be given two mappings, one that represents a function and another that does not. Students will illustrate both equations on separate pages.
Conclusion
In review, students benefit from a review of topics related to mapping to make connections between the old and new information. When students visualize comparative relationships between concepts, they may also be able to recall these ideas with greater ease. Last but not least, fun, group activity provides positive learning experiences for learning.
You may also be interested in the following post. Click the title below:
Domain and Range with Algebraic Functions: How to Understand
Looking for More Materials?
Click the button below to view more of my educational resources!
