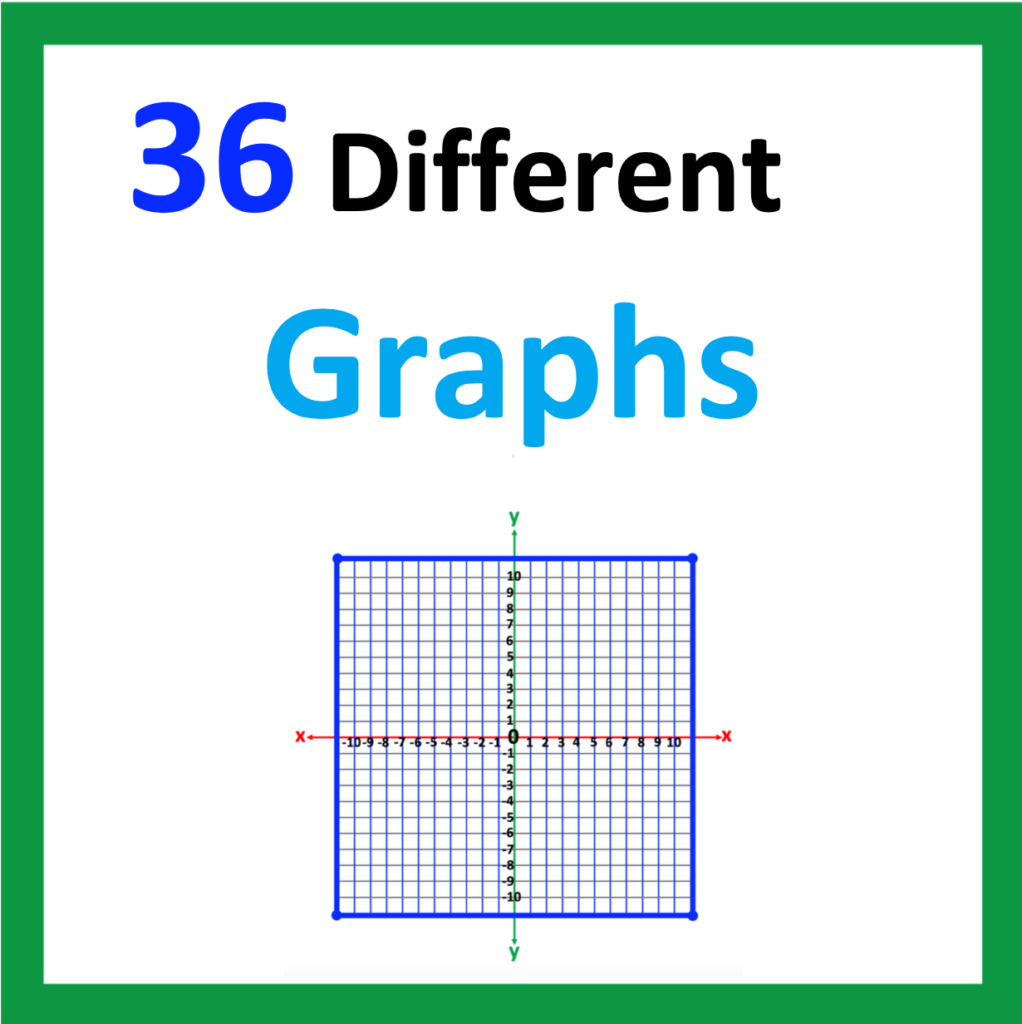
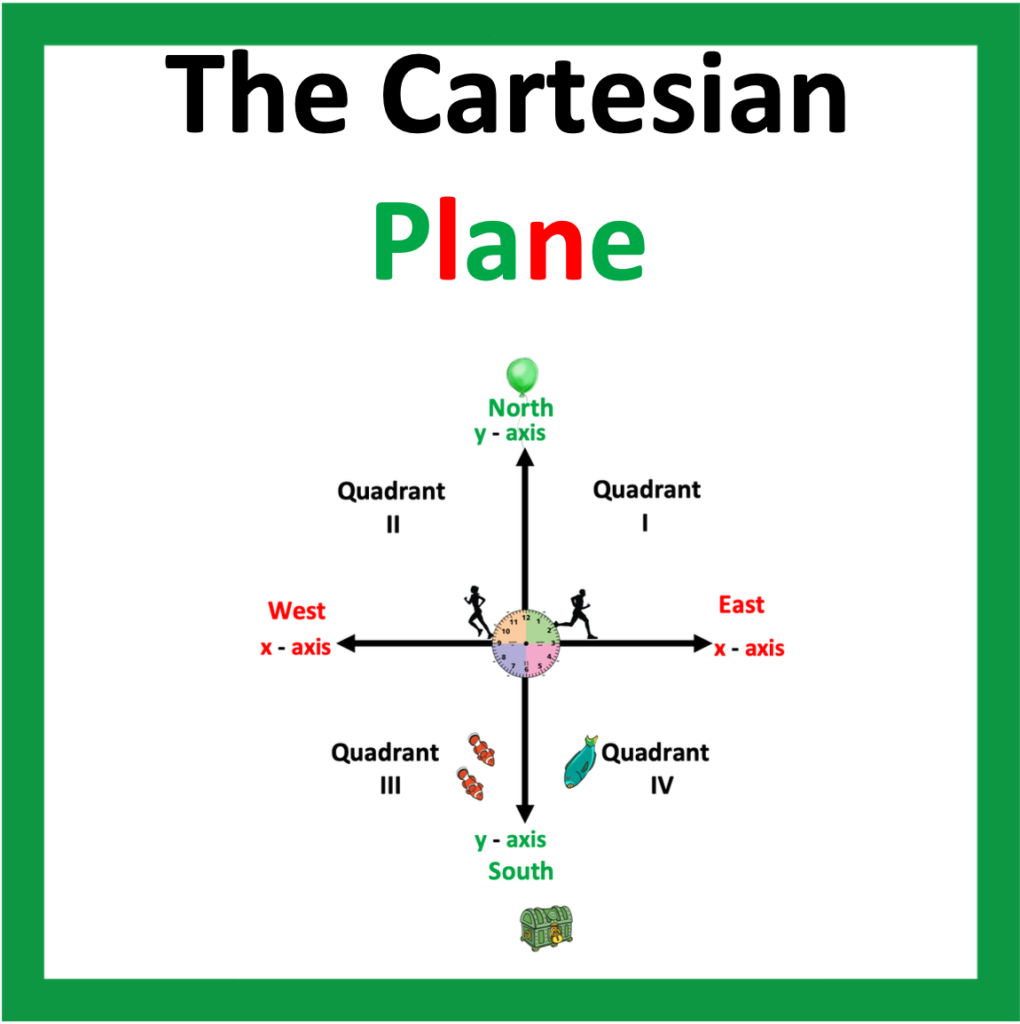
Have your students ever asked, “How does this equation have anything to do with a line on the graph?” To our students, the relationship between an equation and a line can appear unrelated, and abstract. As you continue to read, you will discover strategies, How to Successfully Explain the Relationship Between x/y Coordinates, and Linear Equations.
Contents:
- Introduction
1. Lost in the Lingo: Complex Words
2. Word to Picture
3. Words to Pictures: Numbers on a Number Line
4. One Inequality Statement and a Picture in the Form of a Graph
5. X/Y Coordinates and Points on a Graph
6. Using Coordinate Pairs to Plot Points and a Line
7. From Equation to Line
8. Testing Points: “Will these points really form a line?”
Conclusion
1. Lost in the Lingo: Complex Words
Graphing concepts include words with complex meanings. This is one reason why students struggle with graphing.
Consider the following words or phrases:
Quadrants
Origin
Cartesian Plane
X/Y Plane
X-Axis
Y-Axis
Coordinates X and Y
Ordered Pairs
Plotting Points
Linear Equations
To make matters more interesting, some words mean the same thing such as X/Y Plane and Cartesian Plane.
In addition, graphing lines involves using linear equations to plot points and graph lines which include both an x and y value. Students often find it difficult to see the relationships between points, lines, and equations. To help students see these connections, the use of pictures and illustrations is most helpful.
2. Word to Picture
A line on a graph can be referred to as a picture of an equation. However, say this to the average student. It is most likely students will question the meaning of the statement.
On the other hand, starting with literal words to pictures that students can relate to will help students begin to see this relationship. Start by providing simple words to pictures that students can relate to. Go from simple to complex. Below are examples.

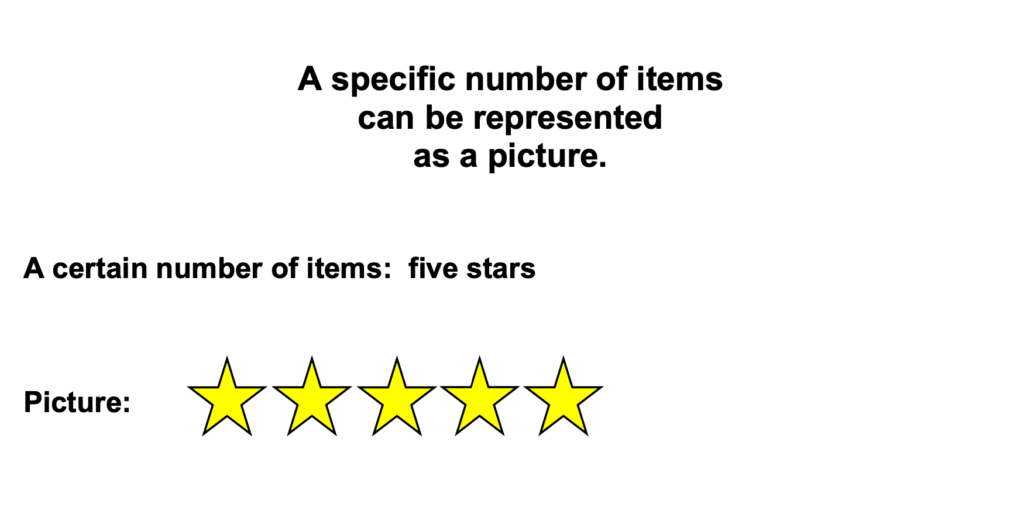
In your classroom, feel free to change out examples to meet the characteristics of your classroom. The greater the relatability, the greater the buy-in. For example, if it is football season, word: football, picture: football.
3. Words to Pictures: Numbers on a Number Line
After providing literal meanings of words to pictures, students are ready to think about graphs they are already familiar with, such as numbers on a number line.
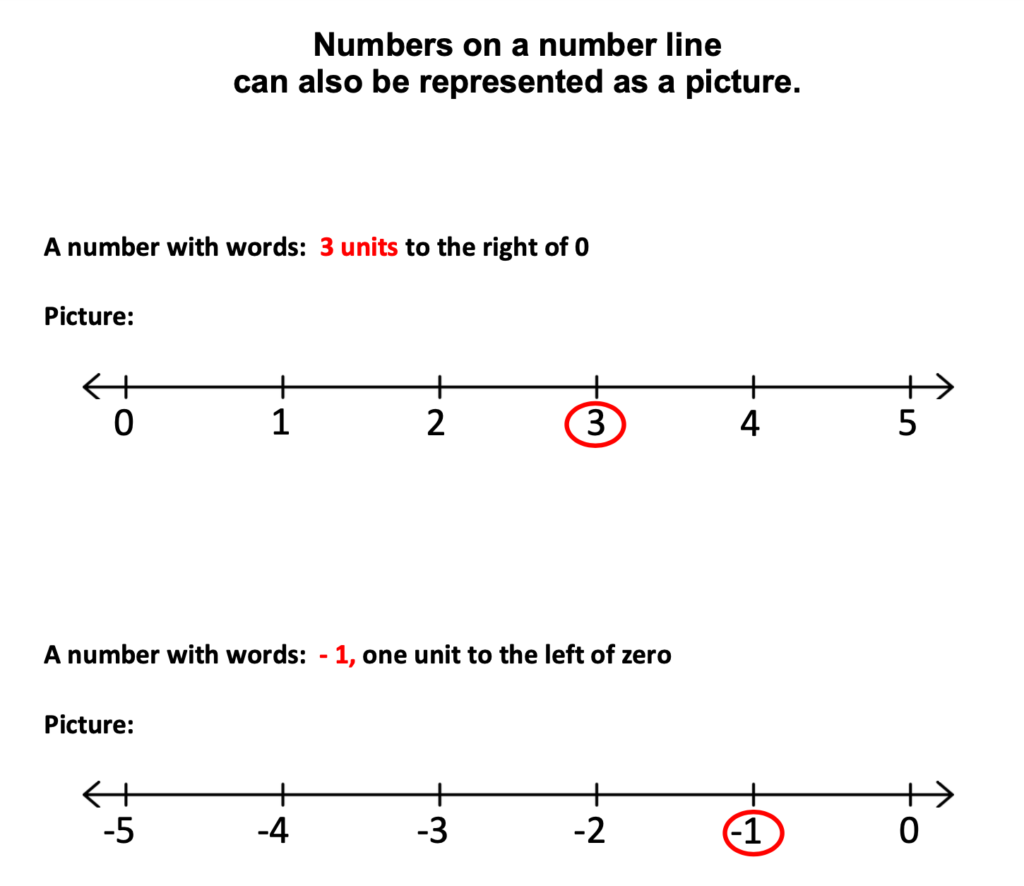
4. One Inequality Statement and a Picture in the Form of a Graph
If students are familiar with graphing inequalities of one variable, this may be a good time to briefly review this concept which will help students see the connections between an inequality and later, an equation.


5. X/Y Coordinates and Points on a Graph
Once students are able to plot a point on a number line, or graph a one-variable inequality, introduce students to creating x/y coordinates.
Some students may already be familiar with functions, such as plugging in one value to get another value. If this is the case, they have some understanding of this concept already. This is the approach to introduce next.
Below I have identified my function machine as, “The Math Machine” though you may have another preferred term for it.
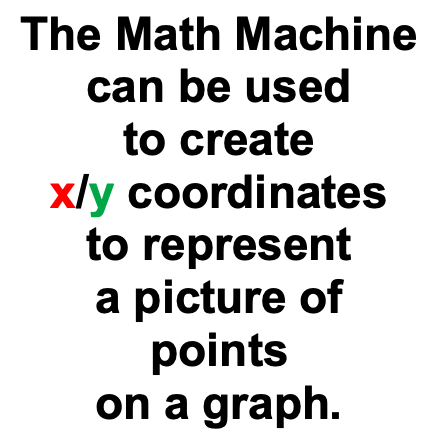
The next three illustrations refer to steps for calculating x, y coordinates using The Math Machine.
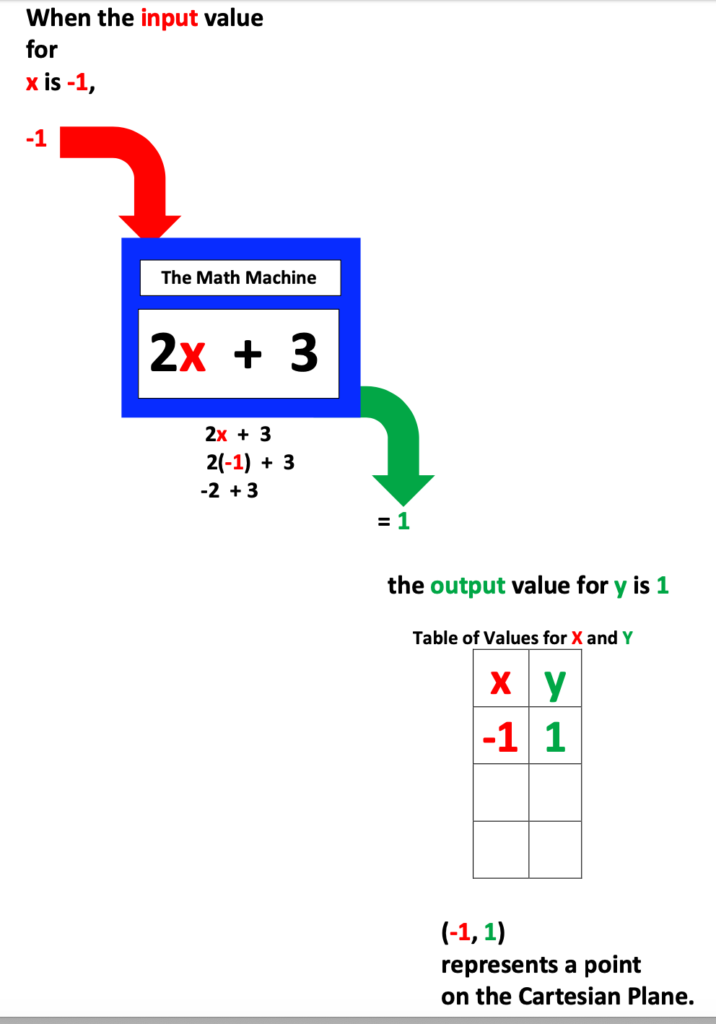
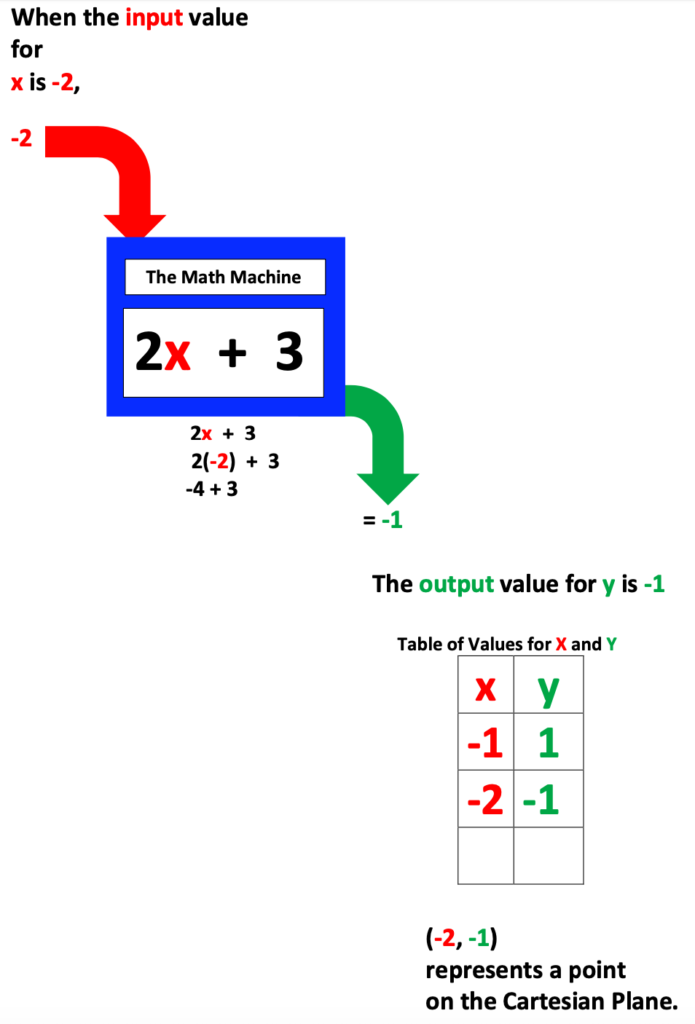
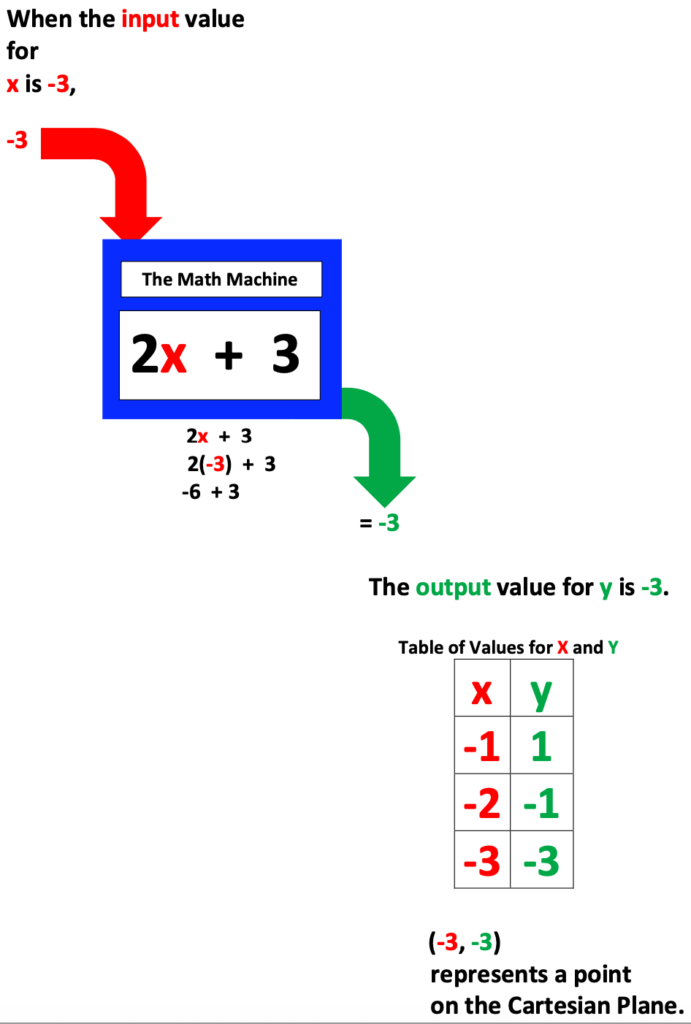
Also, if you have the time and resources, bring a smoothie machine to class and let each student create their own special recipe, after identifying the input flavored ingredient to add to the base ingredient.
In regards to ingredients, this activity will be more appealing with bananas! Yes! Pun intend.
6. Using Coordinate Pairs to Plot Points and a Line
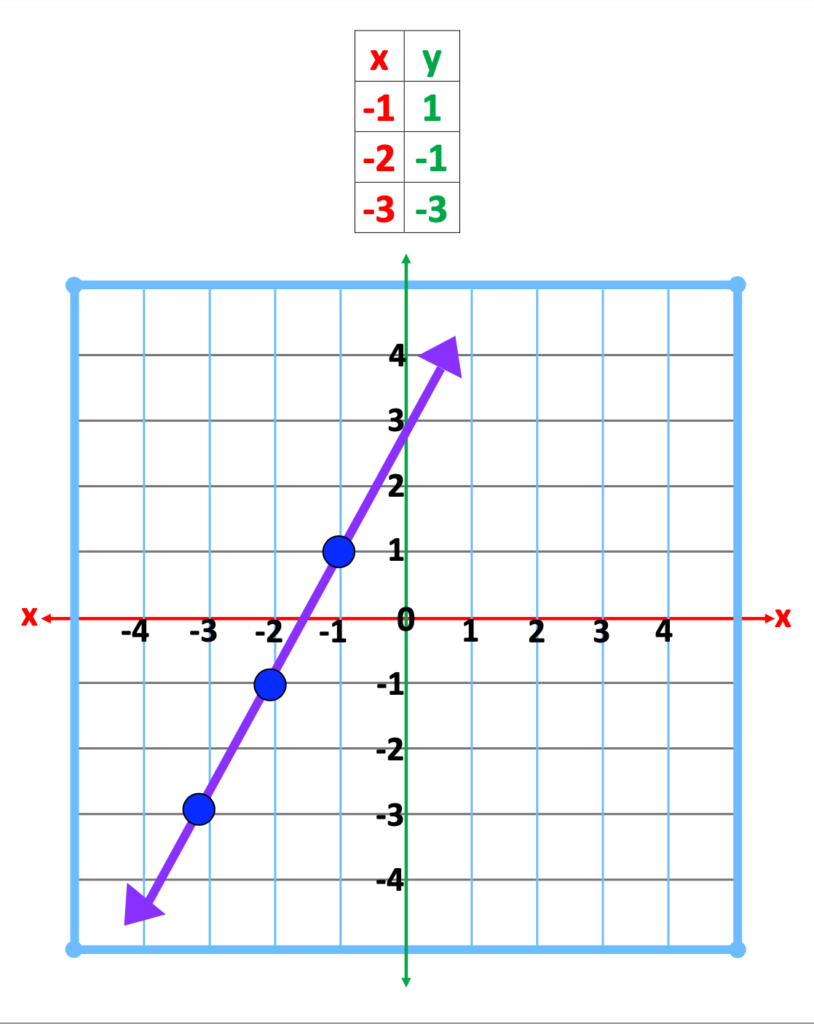
After x/y coordinates have been calculated, students are ready to plot these points on the Cartesian Plane. Mention that when these points are on the graph, when connected, a line is created.
Next, encourage students to practice calculating x/y coordinates, plotting points, and drawing a line through the points. Such practice will help students more fully understand the relationship between x/y coordinates and linear equations
7. From Equation to Line
After students can form a line from a list of coordinates, they are ready to make connections between a linear equation and the picture, a line on a graph.
Below is an illustration explaining the substitution method for using an x value to find the y value.
For example, in the equation below, y = 2x + 3, when the x value is – 1, its paired y value can be found by isolating y in the equation. The same is true when x = -2, and -3.
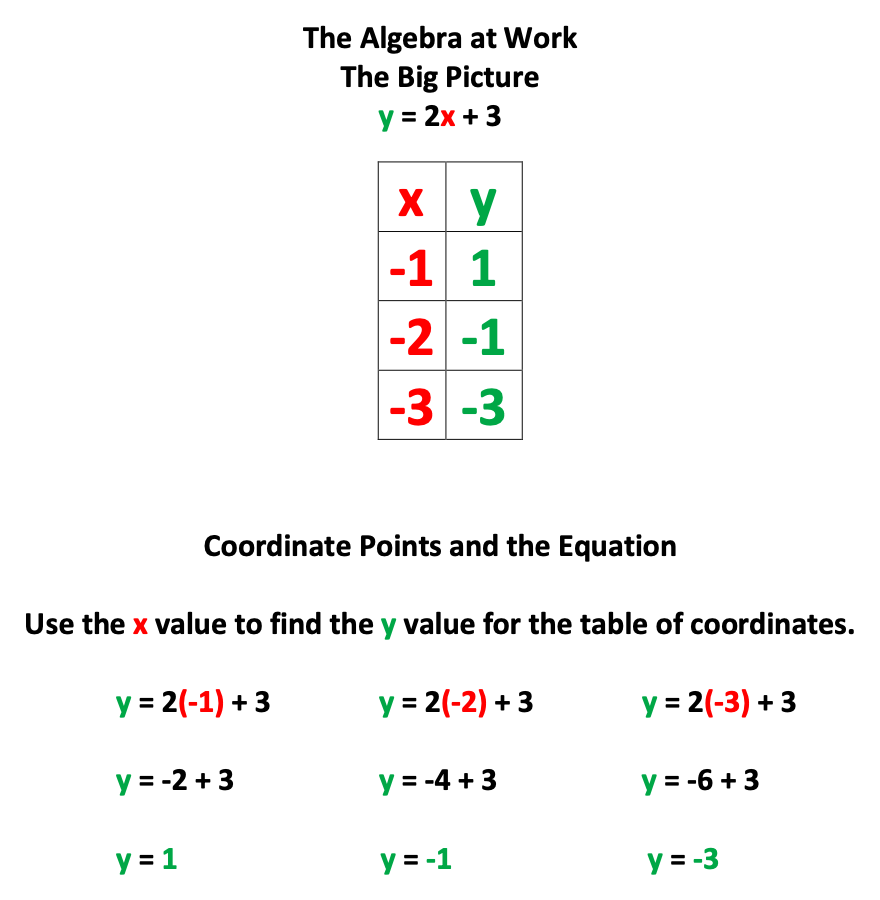
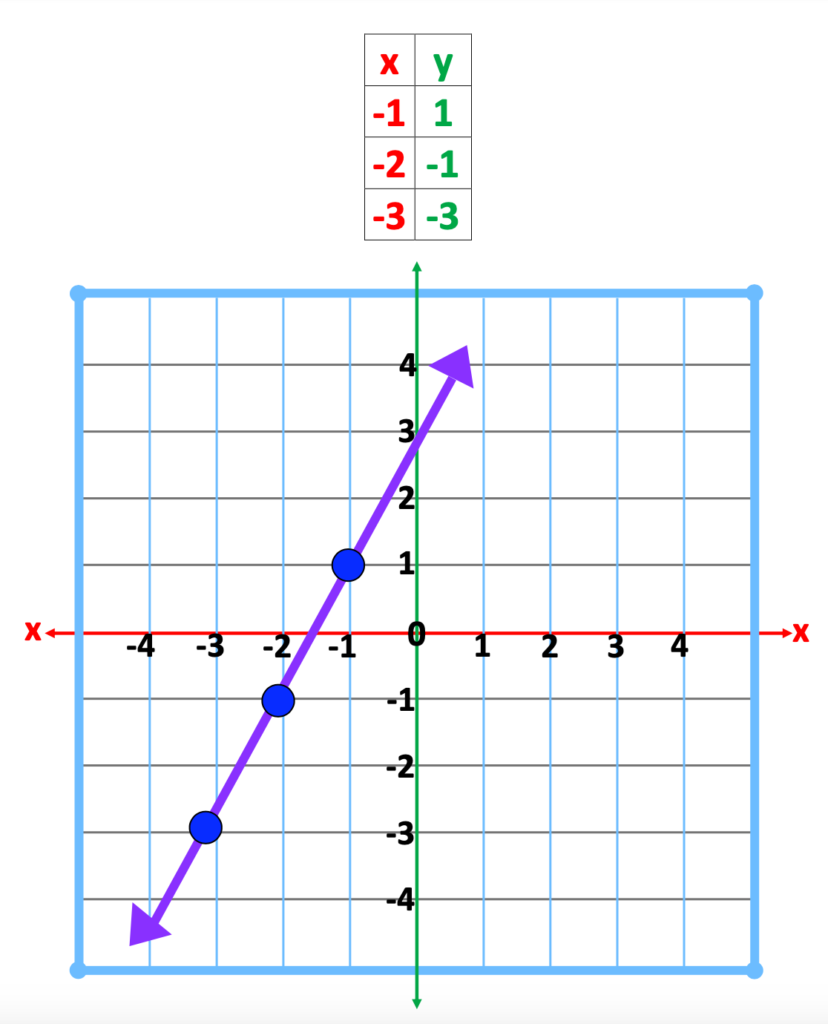
Though the procedure for finding the y values may appear different, these same coordinates points will result in the same line on the graph.
8. Testing Points: “Will these points really form a line?”
Students may benefit from a quick review for testing equations when given a specific number for a variable. After completing this activity, students will more likely see the relationship between this task and determining if all x/y coordinate pairs are solutions which will result in a line when points are plotted and connected.
Show students that when each x/y coordinate pair is plugged into the equation, and the end result shows the same numbers on both sides of the equation, this means that all points when plotted will result in a line.
As illustrated below, in the equation, y = 2x + 3, when -2 is plugged in for x, and -1 is plugged into y,
the equation results in 1 = 1. This is only the first x/y coordinate pair. All listed coordinates must be tested to prove that all points when plotted will result in a line.
It is through this practice that students will begin to see the relationship between x/y coordinates and linear equations.

Conclusion
Start simple. Review and practice through the process where needed. Before you know it, students will finally get the picture of the relationship between x/y coordinate and linear equations.
